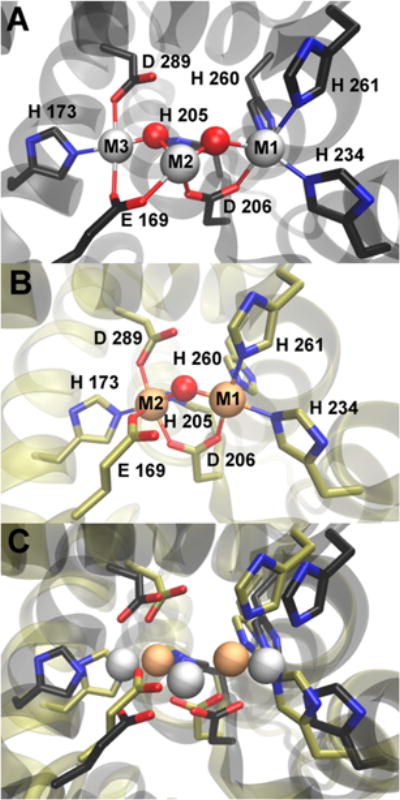
Figure 7.

(A) Trimetal site in the TM0186 HD-GYP domain structural model. (B) Dimetal TM0186 site structure obtained from the molecular dynamics simulation. Lines represent M1-O/N or M2-O/N interatomic distances within the range 2.0–2.2 Å. (C) Overlay of the trimetal and dimetal TM0186 structures from panels A and B. In all panels, red and blue colors represent oxygen and nitrogen atoms, respectively. Red spheres represent metal-bridging solvent oxygens. Gray or tan spheres represent metal atoms in the tri- or dimetal sites, respectively.
