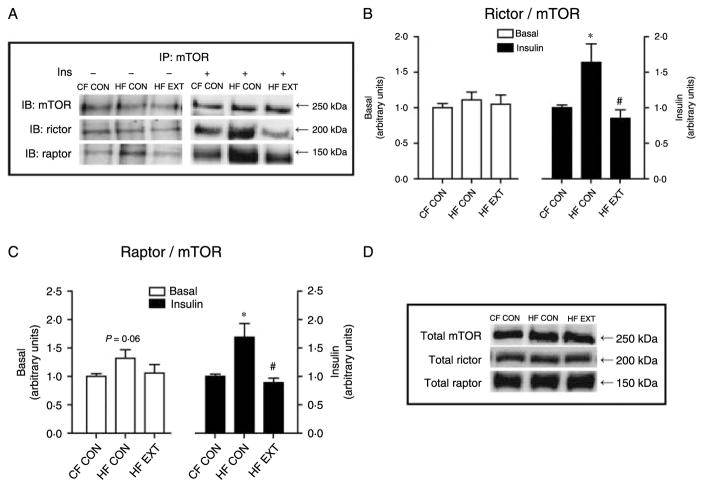
Figure 2.
The basal or insulin-stimulated formation of the mTOR complexes in response to high-fat feeding or after exercise training was determined by immunoprecipitation of mTOR followed by western blotting to detect its binding partners, (A) rictor and raptor, (B) rictor bound to mTOR, (C) raptor bound to mTOR are expressed as arbitrary units (mean±S.E.M., n=6–8). Relative protein levels of total mTOR, total rictor and total raptor (D) were quantified by densitometry. Representative blots are shown. Significant differences between groups *P<0·05 versus CF CON, #P<0·05 versus HF CON.

