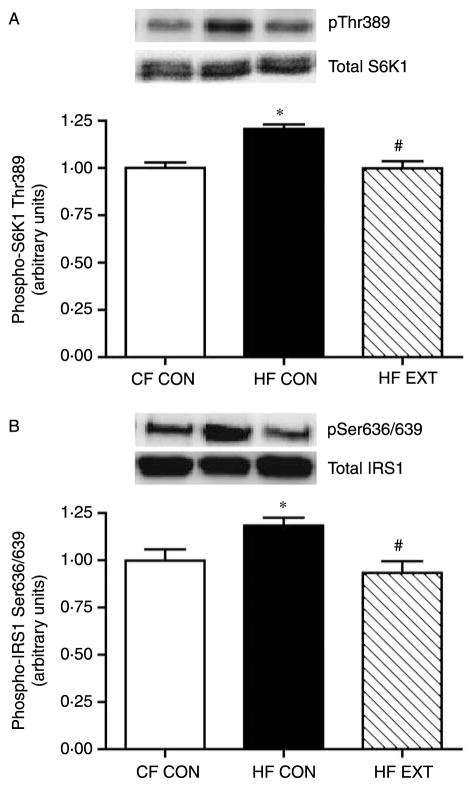
Figure 3.
The insulin-stimulated phosphorylation of S6K1 on Thr389 (A), IRS1 on Ser636/639 (B) were quantified using western blot analysis and densitometry. Representative immunoblots are shown on each figure. Values are expressed as arbitrary units (mean±S.E.M., n=8). Significant differences between groups *P<0·05 versus CF CON, #P<0·05 versus HF CON.

