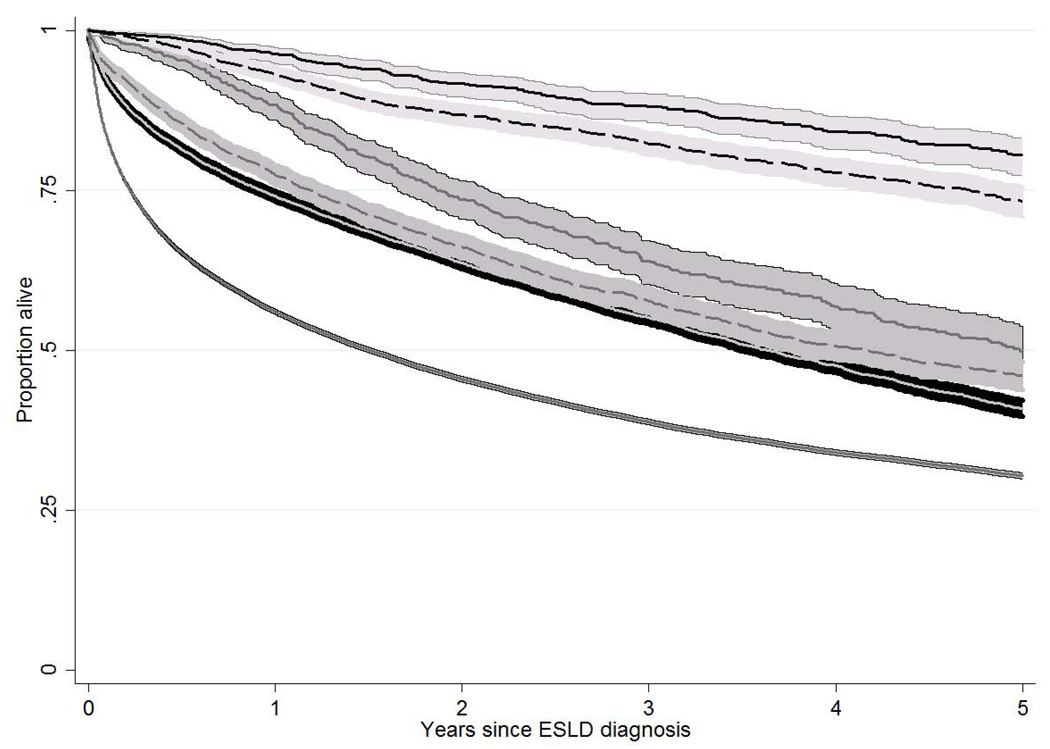
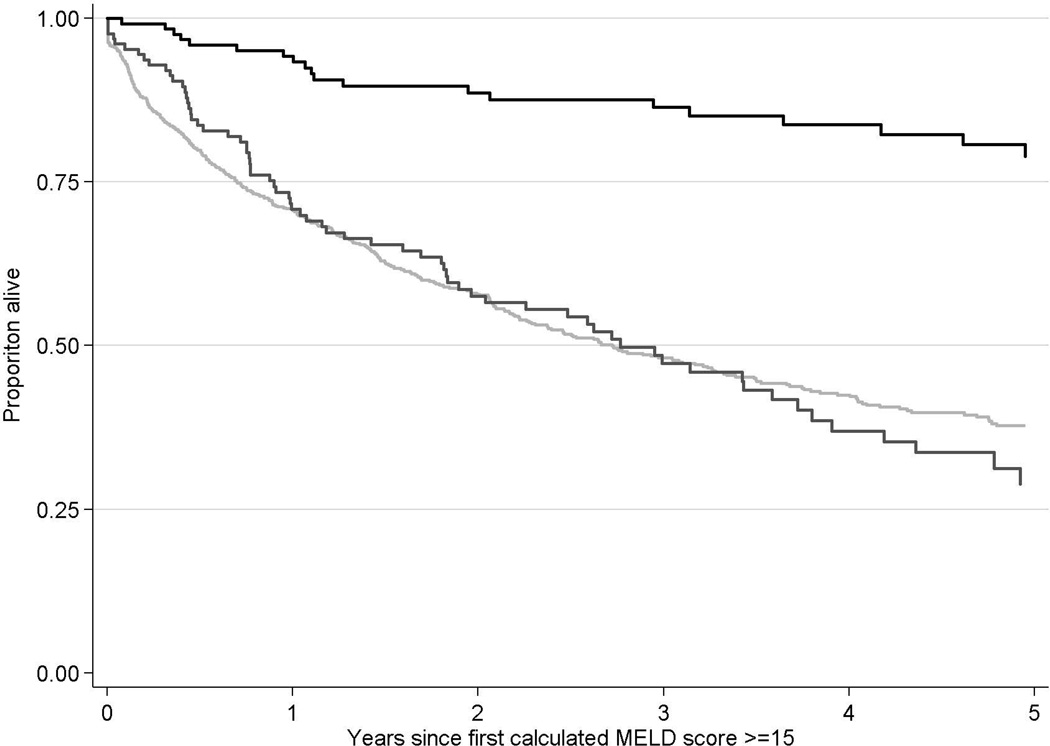
Figure 2 (two panels).
- a: Unadjusted patient survival of patients with end-stage liver disease in HealthCore and Medicaid, stratified by waitlisting and transplant status
-
Figure legend
- Risk table
Years since ESLD diagnosis 0 1 2 3 4 5 Healthcore; never listed 15,045 7,992 5,014 3,199 1,985 1,196 Medicaid; never listed 61,303 28,148 19,476 13,507 9,017 5,590 HealthCore; listed, not transplanted 897 747 544 393 294 200 Medicaid; listed, not transplanted 3,615 2,214 1,581 1,100 711 438 HealthCore; listed, transplanted 882 829 722 624 493 395 Medicaid; listed, transplanted 2,788 2,149 1,706 1,312 924 588
-
- b: Unadjusted patient survival of patients with end-stage liver disease in HealthCore with a calculated MELD score ≥15
-
Figure legend
- Risk table
Years since ESLD diagnosis 0 1 2 3 4 5 Never listed 949 496 321 216 162 108 Listed, not transplanted 128 81 56 38 23 12 Listed, transplanted 125 105 84 71 57 44
-


