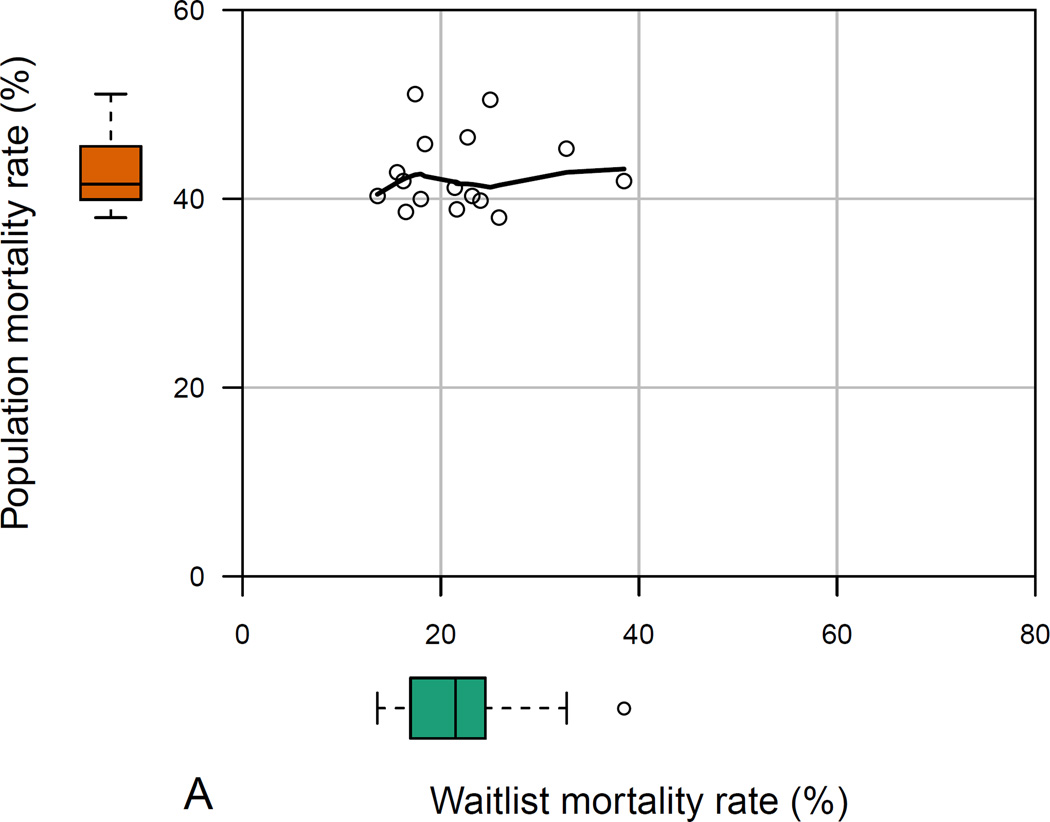
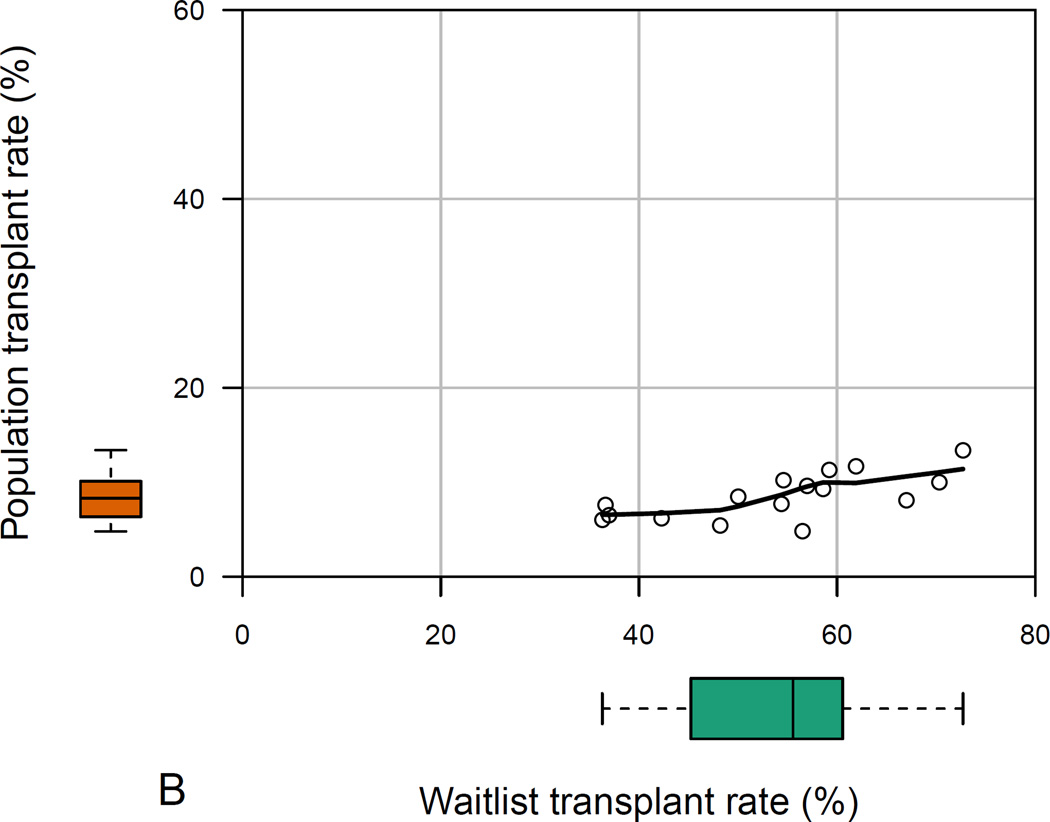
Figure 3 (two panels).
- a: Among-state measures of waitlist- and population-level mortality in HealthCore patients with ESLD*
- Footnote: * Data reported for the 16 states with ≥100 HealthCore patients with end-stage liver disease. The main plot demonstrates the correlation between waitlist- and population-level mortality rates, while the box-and-whisker plots demonstrate the absolute range in waitlist-and population-level mortality rates among the 16 sampled states.
- b: Among-state measures of waitlist- and population-level transplant rates in HealthCore patients with ESLD*
- Footnote: * Data reported for the 16 states with ≥100 HealthCore patients with end-stage liver disease. The main plot demonstrates the correlation between waitlist- and population-level transplant rates, while the box-and-whisker plots demonstrate the absolute range in waitlist-and population-level transplant rates among the 16 sampled states.


