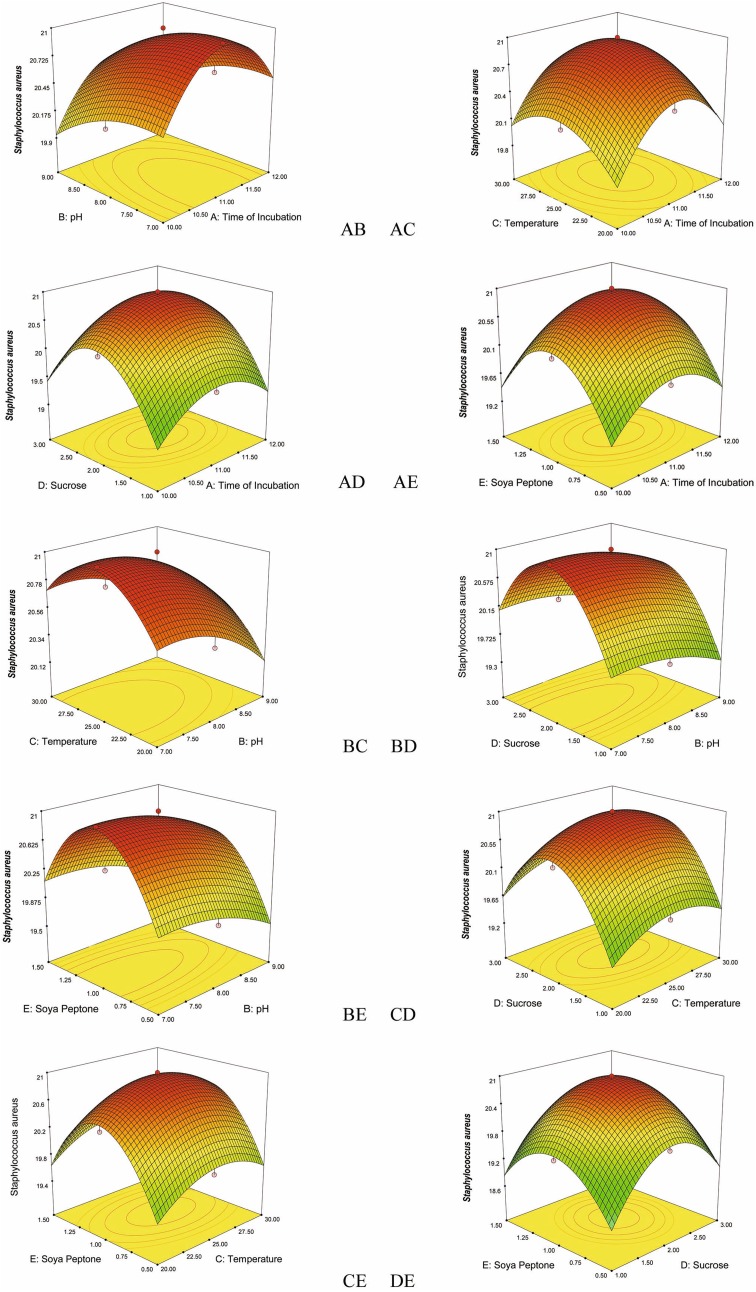
Fig. 1.
Response surface plots consisting of three-dimensional views and contours showing interactive effects of selective variables on zone of inhibition (mm) of the bioactive compound production by VSM 8 against Staphylococcus aureus: (AB) time of incubation and pH, (AC) time of incubation and temperature, (AD) time of incubation and concentration of sucrose, (AE) time of incubation and concentration of soya peptone, (BC) pH and temperature, (BD) pH and concentration of sucrose, (BE) pH and concentration of soya peptone, (CD) temperature and concentration of sucrose, (CE) temperature and concentration of soya peptone, (DE) concentration of sucrose and concentration of soya peptone

