Figure 4.

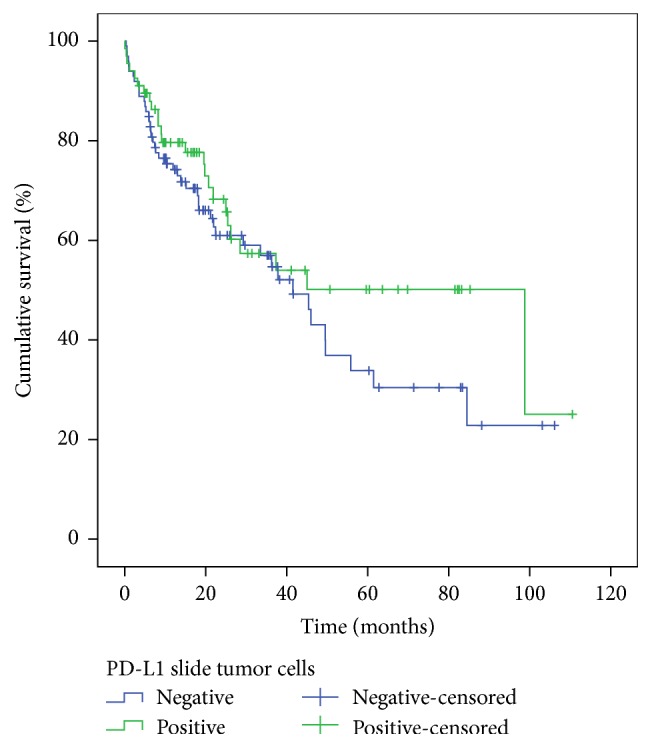
Overall survival according to PD-L1 expression in tumor cells. x-axis: time after diagnosis in months. y-axis: percentage of patients alive (total of 177 patients).

Overall survival according to PD-L1 expression in tumor cells. x-axis: time after diagnosis in months. y-axis: percentage of patients alive (total of 177 patients).