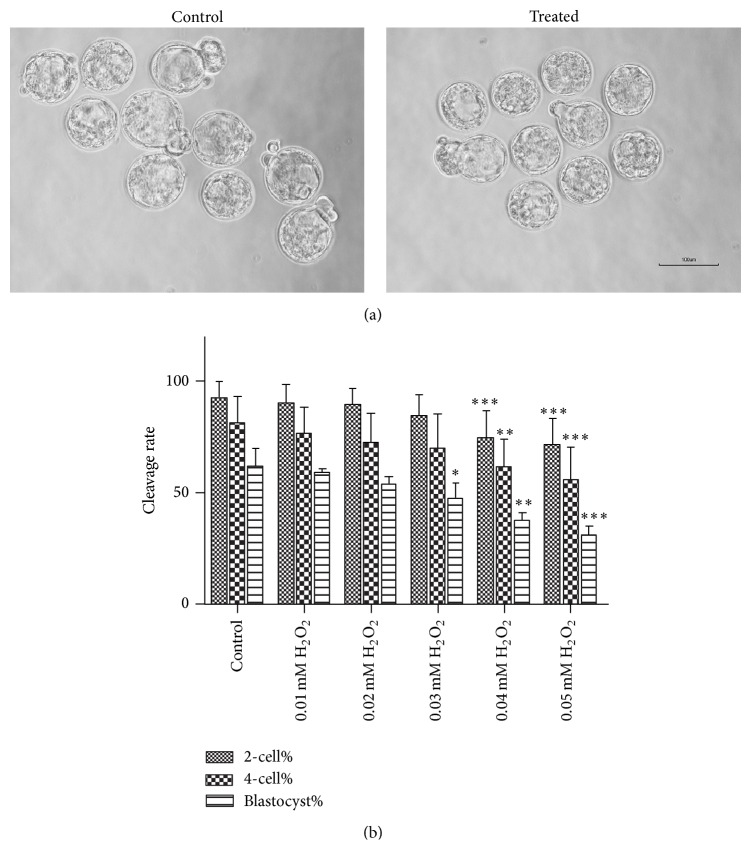
Figure 1.
Comparisons of embryo development between zygotes from groups with different concentration of H2O2 and control group. (a) Representative images of embryos at 96 hpi from control group and 0.03 mM H2O2 group. (b) Counting out the cleavage rates from each group, blastocyst formation rate declined from 0.03 mM H2O2 group; early embryos showed stagnation from 0.04 mM H2O2 group. Data are presented as mean ± SD in six independent experiments for each group at least. Differences between the groups were calculated using Chi square test. ∗ P < 0.05; ∗∗ P < 0.01; ∗∗∗ P < 0.001 compared with the control group.

