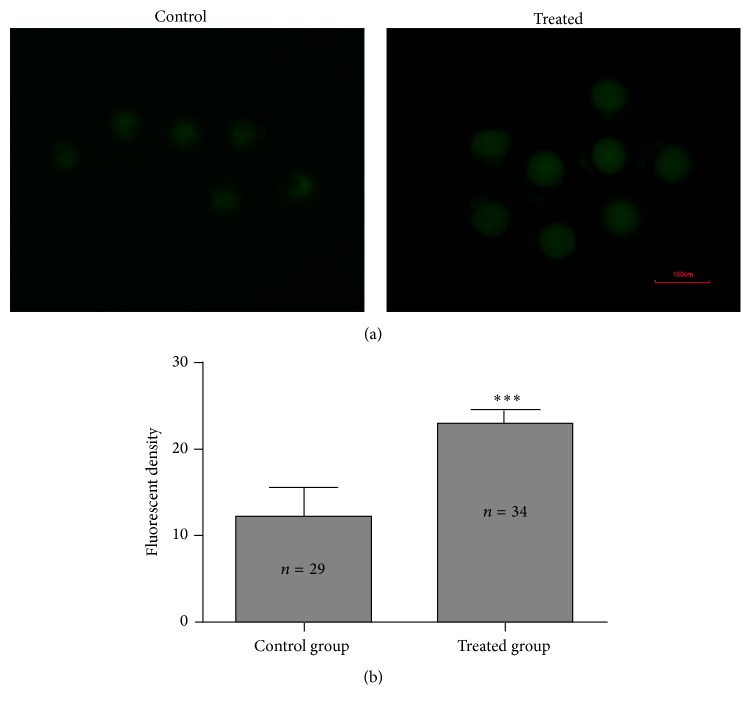
Figure 2.
Comparisons of ROS levels between control group and H2O2 treated group. (a) Representative pictures of ROS levels. (b) Average fluorescence intensity per zygote. Data are showed as mean ± SD, collected from three independent experiments, and each experiment had 5 zygotes at least. n shows the number of zygotes. ∗∗∗ P < 0.001, the treated group compared with the untreated group (Student's t-test).

