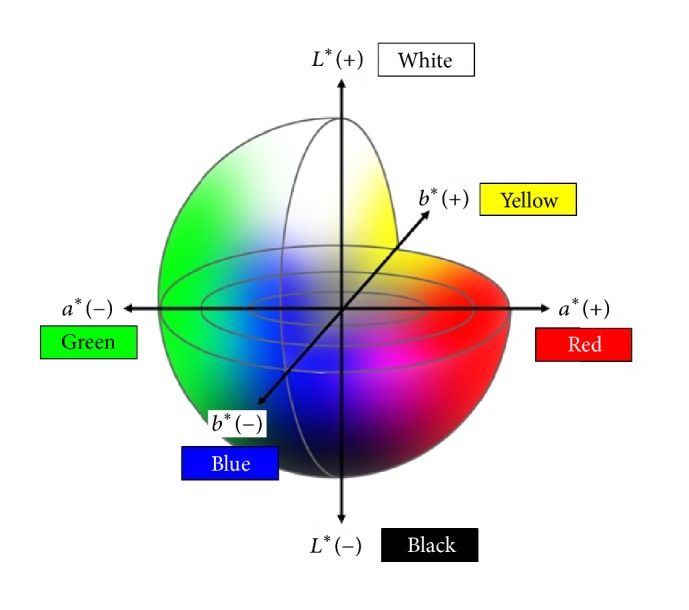
Figure 3.

In the L ∗ a ∗ b ∗ color space system the color differences are visualized as distances in a diagram. L ∗: color brightness (L ∗ = 0 is black and L ∗ = 100 is white). a ∗: position between red and green (negative values are progreen; positive values are prored). b ∗: position between yellow and blue (negative values are problue; positive values are proyellow).
