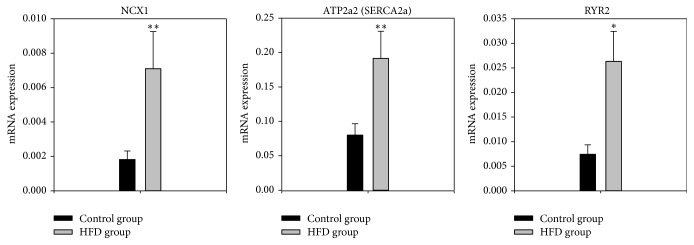
Figure 3.
Normalised to 18-s expression of mRNA for major Ca2+-handling molecules in the left ventricle of the control and obesity groups in arbitrary units referenced to the housekeeper gene 18-s. Means ± SEM shown (n = 8/group). ∗Significantly different from the control group (P < 0.05). ∗∗Significantly different from the control group (P < 0.01).

