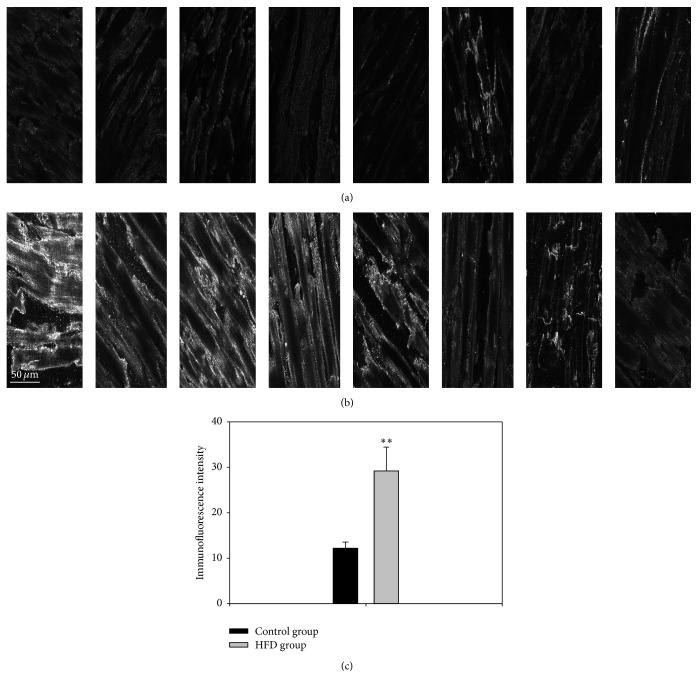
Figure 4.
Representative images of HCN4 immunolabelling (white signal) in the left ventricle of control (a) and obese (b) animals. (c) Mean ± SEM signal intensity in arbitrary units of HCN4 immunolabelling in the left ventricle of the control and obesity groups (n = 8/group). ∗∗Significantly different from the control group (P < 0.01).

