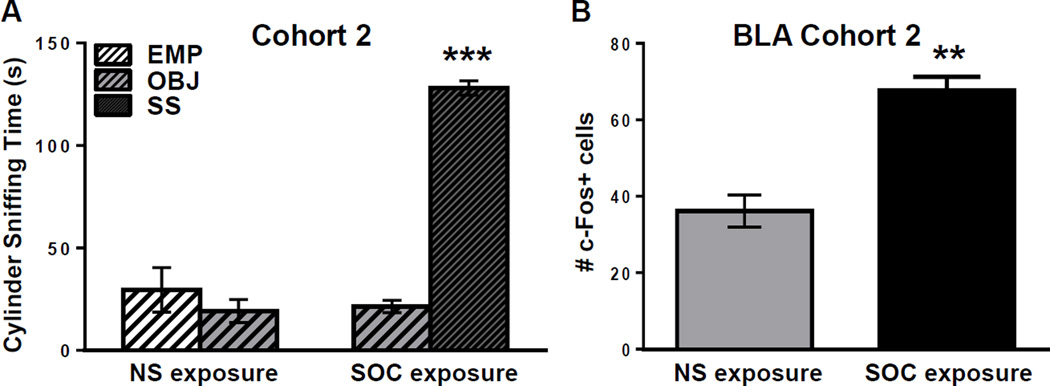
Figure 2.
Cohort 2: B6 mice show high social approach and activation of the BLA during social approach. A: Cylinder sniffing times of B6 juveniles in Cohort 2 NS (n=3) or SOC (n=4) exposure conditions during Phase 2 of the SAT. *** =p<0.0001 SS cylinder vs. OBJ cylinder sniffing. B: Number of c-Fos-positive cells in the BLA of mice from Cohort 2 in the NS and SOC groups. ** = p<0.010. Raw data is presented in the graphs, but a log transformation was required for normality to perform data analysis.

