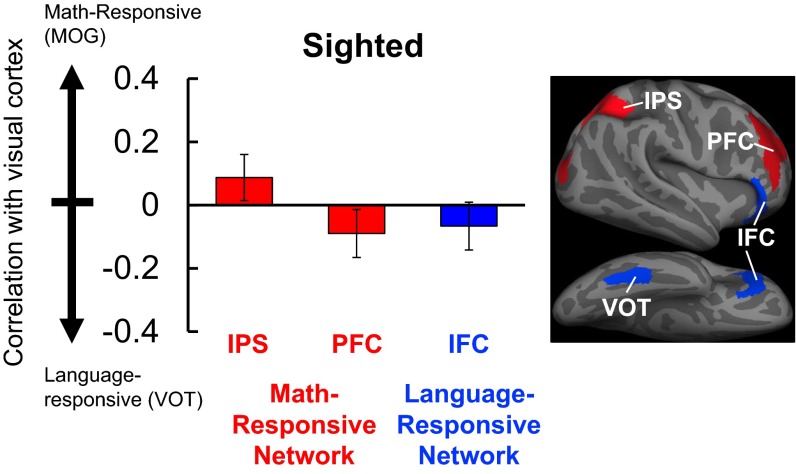
Fig. S7.
Resting-state correlations between visual and frontoparietal areas in the sighted group (n = 9). On the y axis is the difference between correlations across number- and language-responsive regions of visual cortex (defined math > language, blind > sighted). Positive scores (red) indicate stronger correlation with number-responsive visual cortex (MOG), and negative scores (blue) indicate stronger correlation with language-responsive visual cortex (VOT) (error bars represent SEM).

