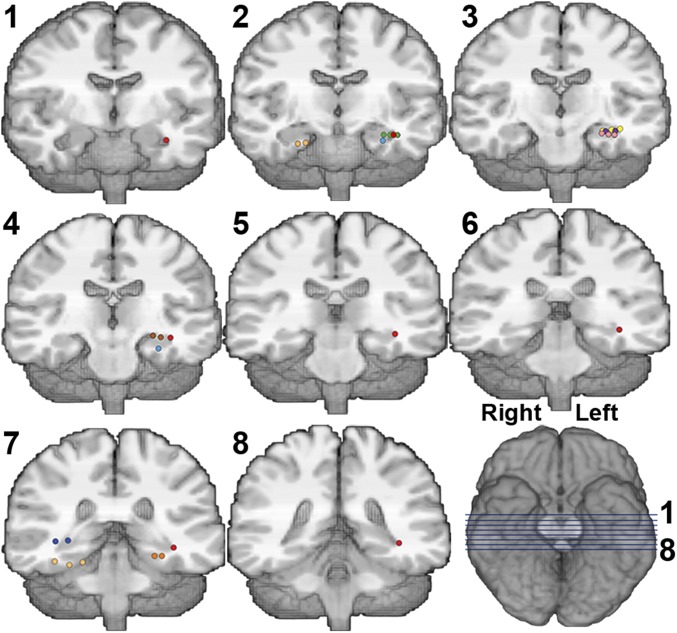
Fig. 5.
Anatomical locations of bipolar contacts with significant contextual theta-power increases. Each color represents one participant, after normalization to the Montreal Neurological Institute template (anatomical localization was performed on the patients’ original scans). Each bipolar contact consists of two immediately adjacent monopolar contacts, indicated as colored dots in this figure. Note that contacts can be adjacent in any spatial orientation. Location of each coronal slice (numbered 1–8) is indicated by blue lines Right Bottom.

