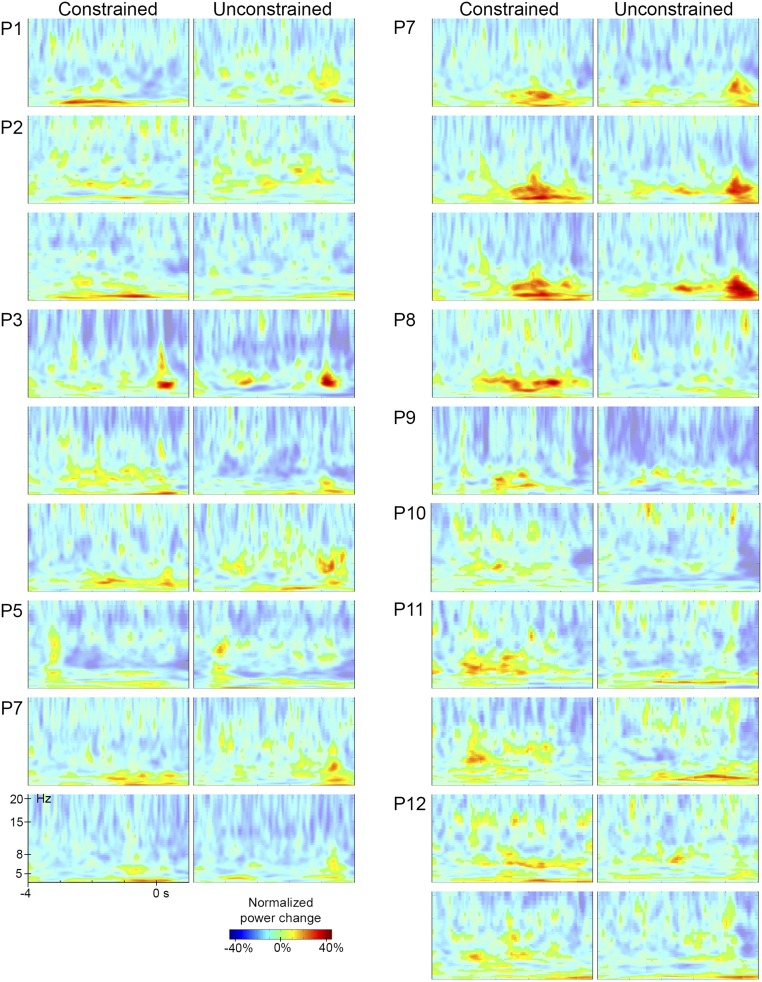
Fig. S2.
Time-frequency representations. Time-resolved spectra for each condition time-locked to picture onset for bipolar contacts of all patients with significant theta effects. Each row of a patient presents the data of one bipolar contact. The color scale represents normalized power changes. Power changes below 0.8% increases are shown with less-strong colors.

