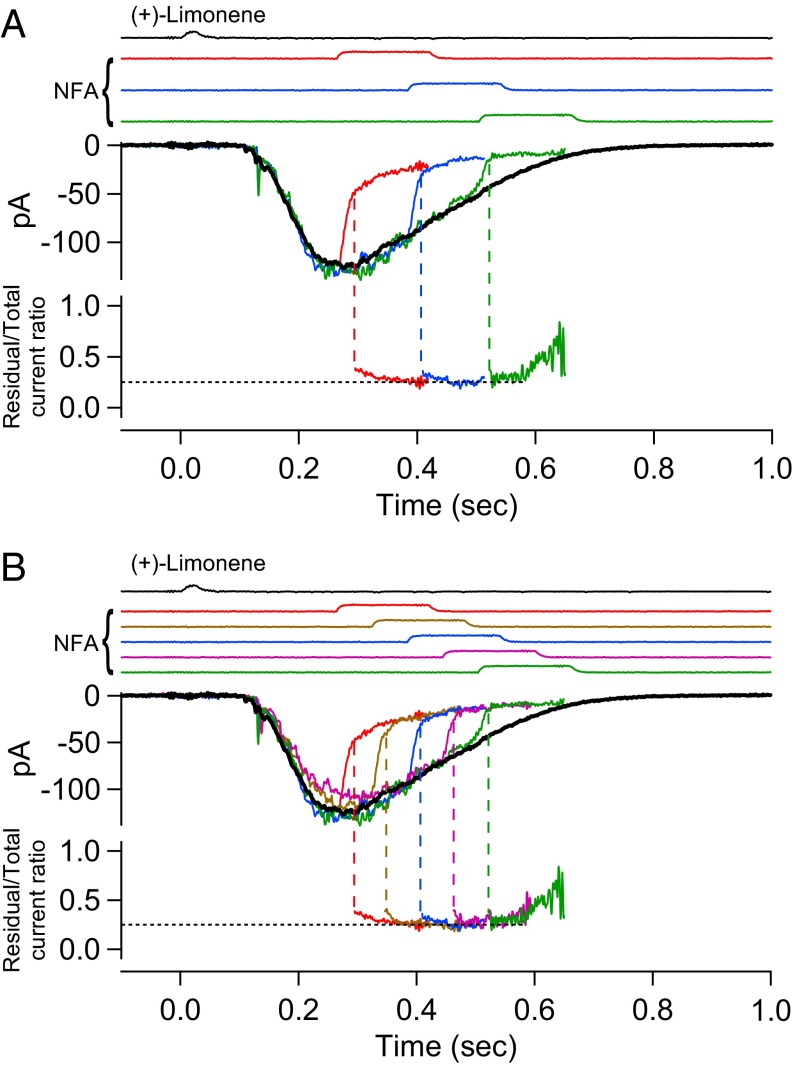
Fig. 2.
Residual olfactory response after NFA inhibition. (A, Upper) Olfactory response elicited by 30-ms, 10 mM (+)-limonene pulse is subjected to successive trials of blockage by 150-ms, 300 µM NFA applied with increasing time delays (at 120-ms increments; color coded). The current reduction by NFA shows a fast phase and a slow phase. Together, the final tails of the residual currents in the three trials provide broadly a profile of the overall residual current, despite gaps of discontinuities. For clarity, the part of the current trace after NFA removal has been removed (Methods). (Lower) Residual current in each NFA trial is divided by the total (control) current response (black trace in Upper); together, they yield a temporal profile of the residual/total current ratio during NFA inhibition, which shows a plateau bottom. (B) Same experiment and same ORN as in A, but with two additional NFA blockage trials filled in to reduce the time gap between successive NFA applications to 60 ms. As such, the profile of the residual current becomes more continuous, revealing clearly a plateau bottom of the residual/total current ratio at 0.25 in this experiment. See text for details. Timings of (+)-limonene and NFA applications based on junction current measurements are indicated at Top of each panel.

