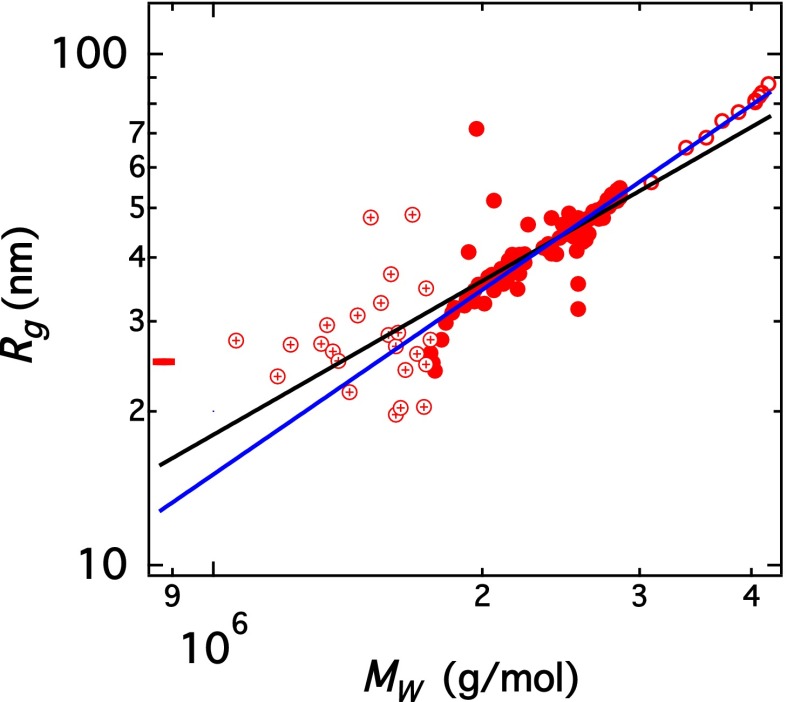
Fig. 4.
Morphology of the emerging assemblies. is plotted against for the kinetic run shown in Fig. 3. Circles with a cross correspond to 10 min and solid circles to 10 60 min. Open circles correspond to data for min, which were obtained from 30 angle readings. The black line corresponds to polydisperse rods with = 1.3 and = 22 g/(mol⋅nm) (Eq. S4). The blue line corresponds to a best-fit power law. The red bar on the axis corresponds to the value before the aggregation process starts.

