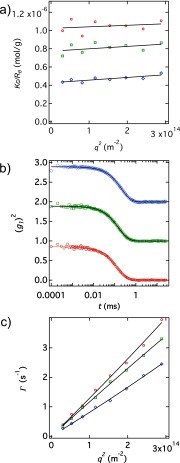
Fig. S3.
Color code: red symbols, t = 0.5 min; green symbols, t = 2 min; blue symbols, t = 35 min. (A) SLS data in the Zimm representation. Lines are fits to Eq. 1 of the main text. (B) Square of the electric field time correlation functions Correlation functions at angle 80° along with fits to Eq. S8. Green and blue curves are shifted vertically by values of 1 and 2, respectively, for clarity. (C) Decay time vs. along with fits to Eq. 2 of the main text.

