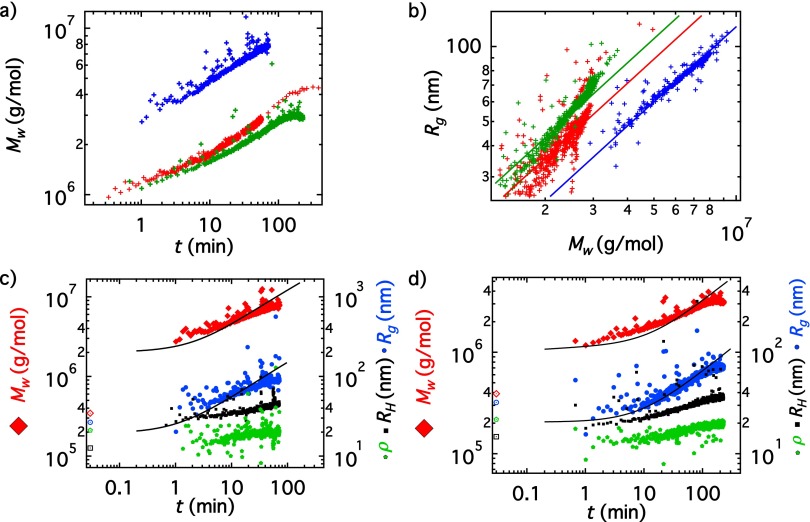
Fig. S7.
(A) vs. time for three different kinetic runs. Blue symbols, c = 0.09 g/L; red symbols, c = 0.07 g/L; green symbols, c = 0.06 g/L. (B) vs. Symbols have the same meaning as in A. (C) (red diamonds), (blue circles), (black squares), and ρ × 10 (green stars) for the kinetic run with vimentin concentration of 0.09 g/L. Large open symbols at t = 0.03 min represent values before addition of KCl. (D) Same as C but for 0.06-g/L vimentin concentration. The lines in C and D represent fits with the kinetic model applied in the same way as done for c = 0.07 g/L in Fig. 5 and Fig. S5. The results from all fits are summarized in Table 1 of the main text.

