Fig. 4.
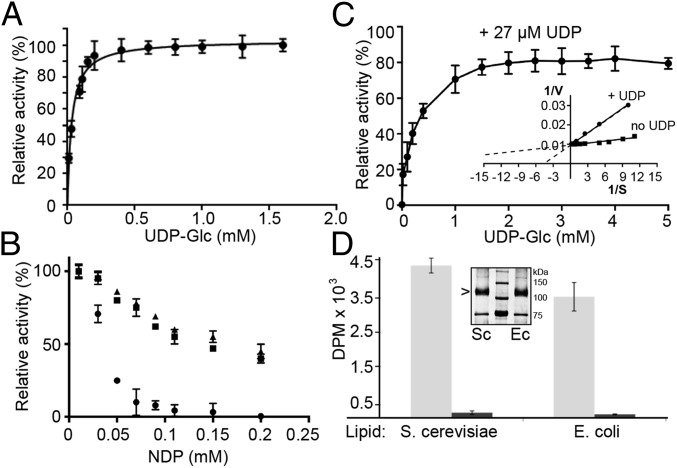
Kinetic analyses of PttCesA8. (A) Titration of UDP-Glc and quantification of the synthesized cellulose. The data were fit to monophasic Michaelis–Menten kinetics, yielding a Km of 30 µM. (B) Cellulose biosynthesis in the presence of 30 µM UDP-Glc and increasing concentrations of UDP (circles), ADP (triangles), and GDP (squares). UDP inhibits cellulose synthesis with a Ki of about 27 µM. (C) UDP competitively inhibits PttCesA8. The catalytic activity of PttCesA8 in the presence of 27 µM UDP and increasing UDP-Glc concentrations is shown relative to its activity in the absence of UDP. (Inset) Lineweaver Burk plot of data shown in A and C. (D) Detergent inhibition of PttCesA8’s catalytic activity. Comparison of PttCesA8’s catalytic activity in intact (light gray bars) and solubilized (dark gray bars) proteoliposomes formed from S. cerevisiae or E. coli total lipid extracts. (Inset) Western blot of S. cerevisiae (Sc) and E. coli (Ec) proteoliposomes. All experiments were performed at least in triplicate; error bars represent SDs from the means.

