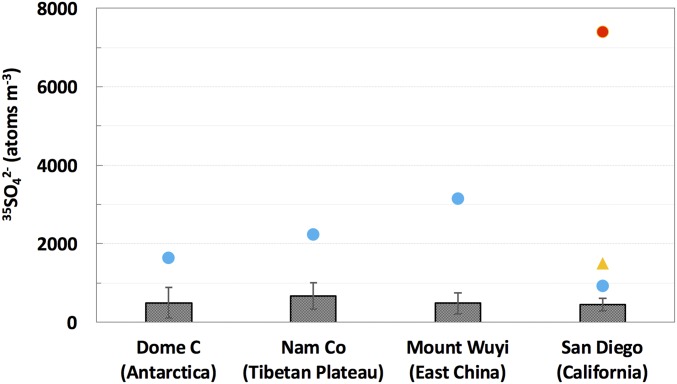
Fig. 1.
The 35SO42− concentration in the fine aerosol sample collected on May 3, 2014 (red circle) and the comparison with annual means (gray bars; error bars stand for 1 SD) and the highest values (blue circles) measured at different sampling sites in previous studies (17–20). The orange triangle represents the sample affected by the trans-Pacific transport of 35S produced from the 35Cl[n,p]35S reaction in Fukushima (25).

