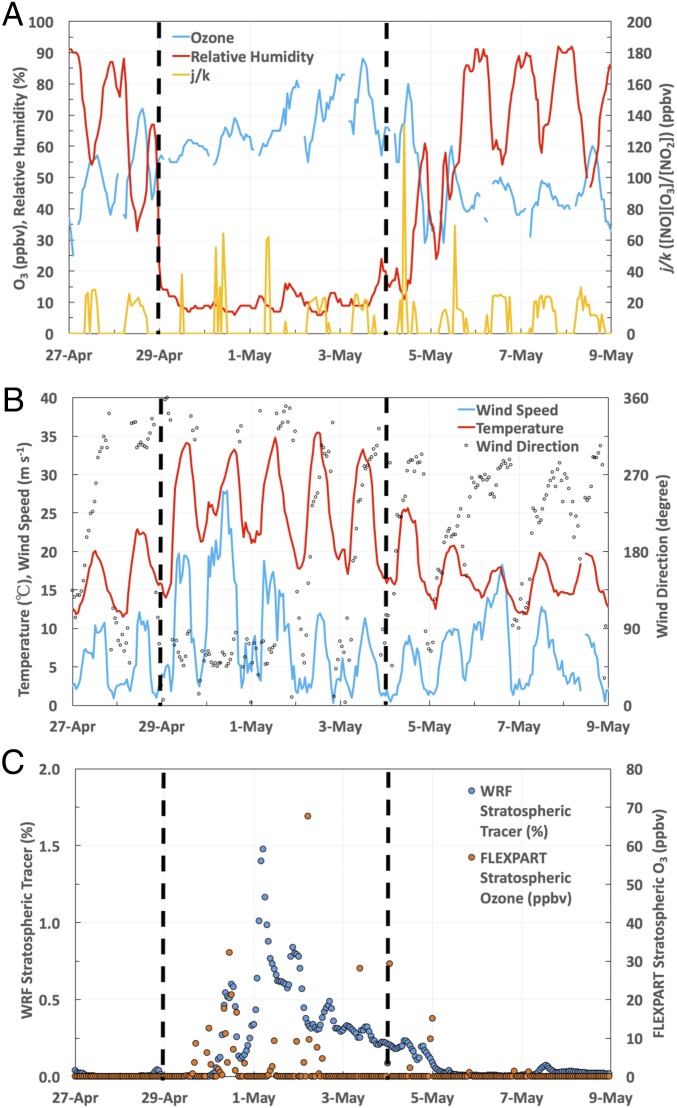
Fig. 3.
Time series of hourly (A) O3, RH, and j/k measured in San Diego (the Alpine monitoring station); (B) temperature, wind speed, and direction measured in San Diego (the Kearny Mesa station); and (C) the simulated WRF stratospheric tracer and FLEXPART stratospheric O3 at the boundary layer in San Diego. The vertical black dashed lines define the period of the Santa Ana event (April 29 to May 3, 2014) based on abnormal RH and temperature.

