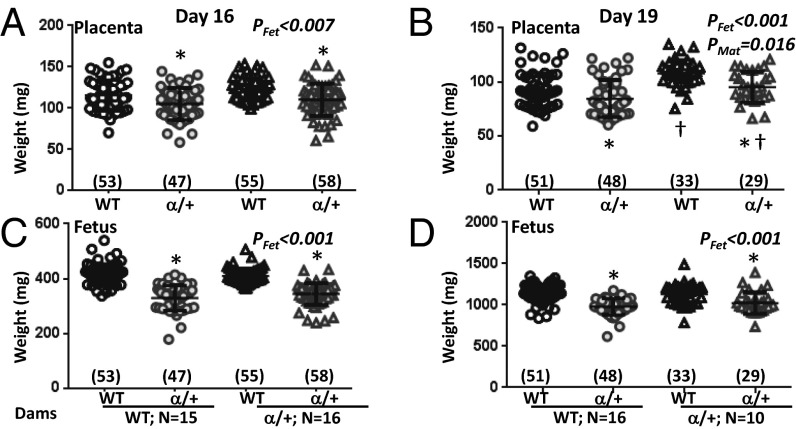
Fig. 1.
Feto-placental growth in response to p110α deficiency. Placental (A and B) and fetal weights (C and D) on D16 (A and C) and D19 (B and D) of pregnancy. Shown are data from crosses where the mother is WT (circle symbols) and α/+ (triangle symbols) with mean denoted as a horizontal line with SEM. Number of fetuses is in parentheses. *Significantly different to WT littermates (P < 0.05, pairwise comparison). †Significantly different to WT dams (P < 0.05, pairwise comparison).

