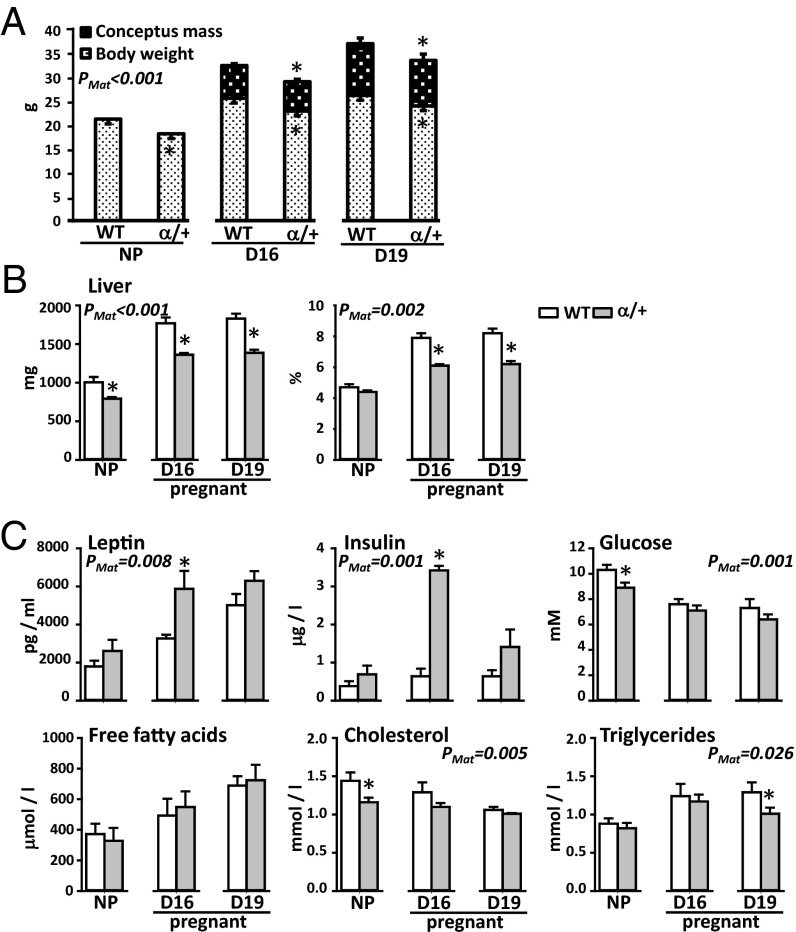
Fig. 2.
The effect of p110α deficiency on maternal body weight (A), hepatic weight (B), and circulating metabolic indicators (C). Mean ± SEM values from age-matched nonfasted WT and α/+ littermates. *Significantly different to WT dams (P < 0.05, t test comparison). Numbers of mice used for body composition and blood glucose were 7–11 and for plasma metabolites and hormones were 5–8 samples per genotype, per age.

