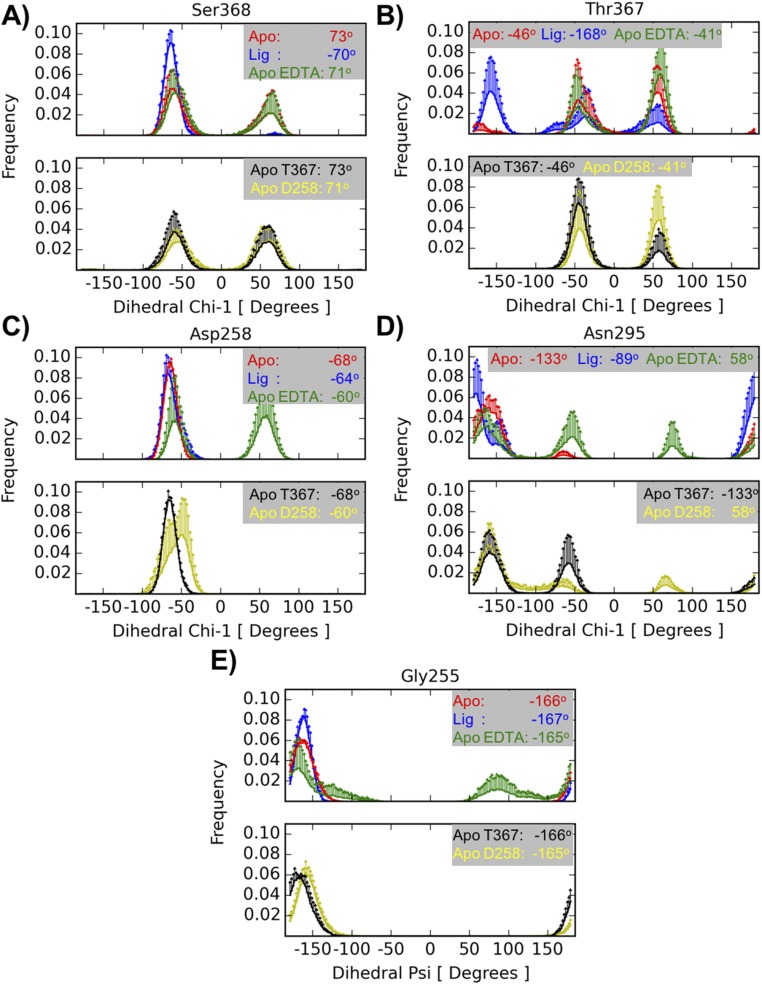
Fig. S4.
Rotameric states from MD simulations. Histograms are computed from five independent runs of each simulated system: unliganded furin (red), furin with inhibitor MI-52 (blue), unliganded furin in the presence of EDTA (green), unliganded furin with Thr367’s χ1 initially set at 60° (black), unliganded furin in the presence of EDTA and with Asp258 protonated (yellow). For residues Ser368 (A), Thr367 (B), Asp258 (C), and Asn295 (D) the measured quantity is the χ1 dihedral-angle, whereas for Gly255 (E) it is the ψ dihedral-angle. The information is split into two panels for clarity. The Upper panel contains plots from the simulations of unliganded furin, furin with inhibitor, and unliganded furin in the presence of EDTA structures; the Lower panel contains plots corresponding to simulations of unliganded furin with Thr367's χ1 initially set at 60° and unliganded furin in the presence of EDTA with Asp258 protonated. Each curve represents an average histogram (solid lines) with 1 SD as upper limit (error bar). The averages were computed from five independent runs. The values in each inset correspond to the values found in the crystallographic structures.

