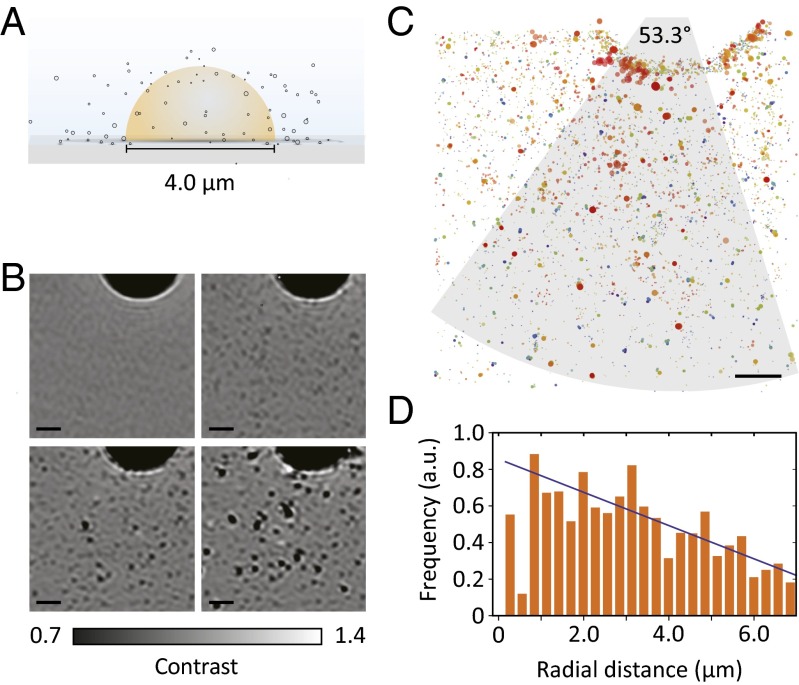
Fig. 3.
Direct observation of the reactive interface. (A) Illustration of the reaction geometry. (B) Flat-field images demonstrating the reaction about the thiol–water interface. Progress of the reaction is from Left to Right and Top to Bottom. (C) Superresolution map of the binding sites within the first 7 min of the reaction shown in B. The color and size of the plot markers encode the arrival time and signal intensity of binding events, respectively. (D) Negative correlation between the frequency of binding events per unit area and the distance from the reactive interface. Shown is the dependence of the bound product density, found within the arc sector depicted by the gray region in C, on the radial distance away from the droplet interface, where a radial distance of zero corresponds to the interface. Solid line shows the fit to a linear function. (Scale bars: 1 μm.)

