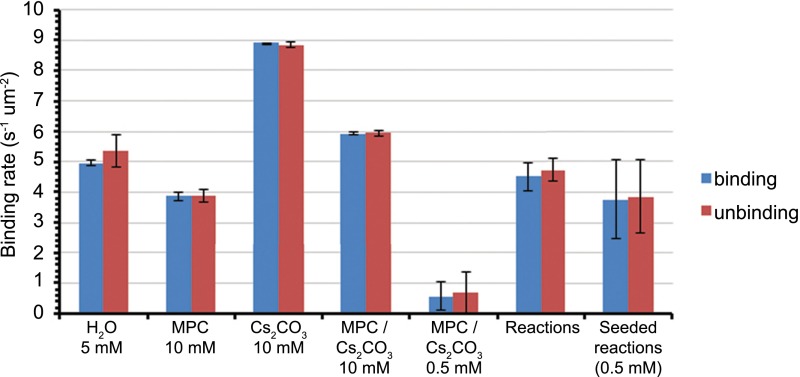
Fig. S4.
Comparison of saturation binding rate between controls and reactions. Each bar corresponds to the average and SD of three measurements of the equilibrium or saturation binding/unbinding rate per unit area. From left to right: pure 3 (5 mM) in H2O, pure 3 (10 mM) in aqueous MPC 2 (600 mM), pure 3 (10 mM) in aqueous Cs2CO3 (200 mM), pure 3 (10 mM) in aqueous MPC 2 (600 mM)/Cs2CO3 (200 mM), pure 3 (0.5 mM) in aqueous MPC 2 (600 mM)/Cs2CO3 (200 mM), saturation binding rate observed in reactions (average of 5 experiments), and saturation binding rate observed in reactions seeded with 0.5 mM 3.

