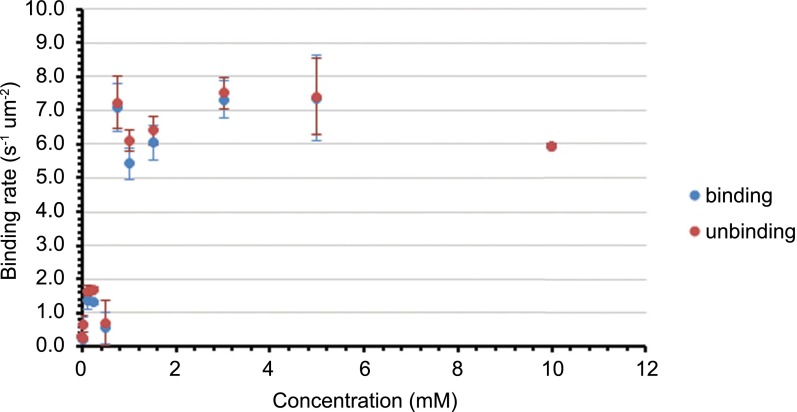
Fig. S7.
Saturation binding rate of 3 vs. concentration of 3. Each point corresponds to the mean and SD of the saturation binding rate (average over 5 min) of pure 3 in aqueous MPC 2 (600 mM)/Cs2CO3 (200 mM). Figs. S5–S7 plot the kinetics of multiple replicates of the reaction between 1 and 2, seeded reactions carried out in the presence of 0.5 mM 3, and negative controls in which MPC 2 is omitted. These data were used to generate Fig. 2 and Figs. S4–S7. All reactions were carried out under standard conditions as described in Materials and Methods. Each data point shows the mean and SD of three consecutive data points, where each data point consists of 1 s of data (1,000 frames) recorded every 6 s.

