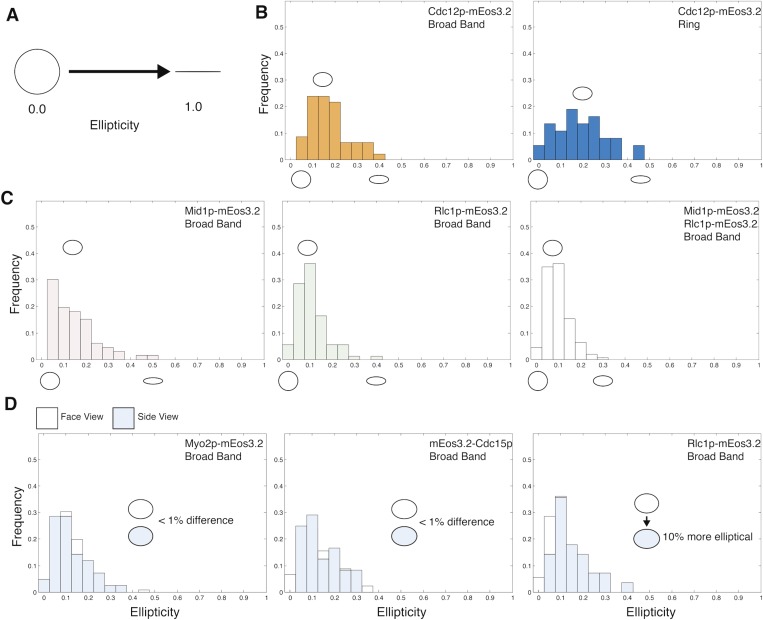
Fig. S5.
Analysis of node shapes by measuring ellipticities of the localizations. (A) An ellipticity value of 0 indicates that all of the localized emitters are clustered within a perfect circle, whereas a value of 1 is a line. (B–D) Frequencies of the ellipticity values of the localizations in nodes labeled with different markers (listed in the upper right corner) in broad bands or in contractile rings (Ring). The distributions of the localizations of all of the markers analyzed for nodes in broad bands were biased toward circular shapes justifying the use of radial density distributions to describe their shapes. (B) The distribution of Cdc12p-mEos3.2 localizations in nodes in the contractile rings was more elliptical, likely owing to their movements during imaging. (C) Mean ellipticities of the distributions of Mid1p-mEos3.2, Rlc1p-mEos3.2, and the double-labeled Rlc1p-mEos3.2/Mid1p-mEos3.2. (D) Bar graphs comparing the distributions of ellipticity values of localizations in nodes labeled with different markers (listed in the upper right corner) in face views (white bars) and side views (blue bars). The distributions of the localizations of myosin II heads (Rlc1p-mEos3.2) were 10% more elliptical in the side view than in face views. There is <1% difference in the ellipticities in the face and side views in the C terminus of the myosin II tails and the N terminus of Cdc15p.

