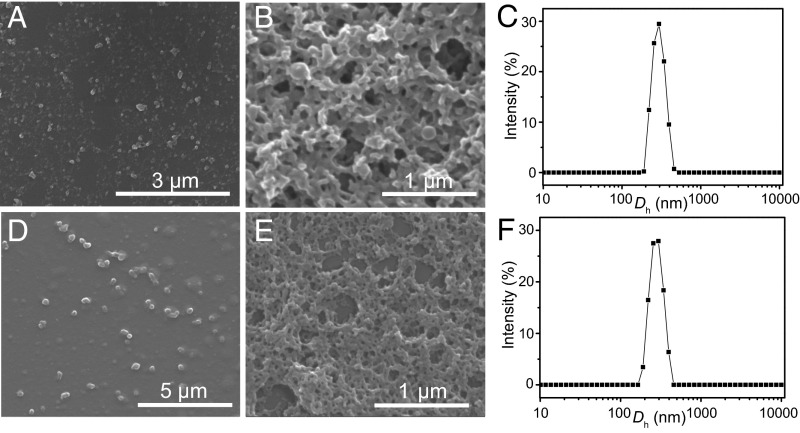
Fig. 3.
Morphology and size analyses of P1 and P2. (A) The formation of nanoparticles at the concentration of 0.1 mg/mL for P1. (B) The formation of network structures at the concentration of 1.0 mg/mL for P1. (C) Size distributions of P1 in methanol at the concentration of 0.1 mg/mL. (D) The formation of nanoparticles at the concentration of 0.1 mg/mL for P2. (E) The formation of network structures at the concentration of 1.0 mg/mL for P2. (F) Size distributions of P2 in methanol at the concentration of 0.1 mg/mL.

