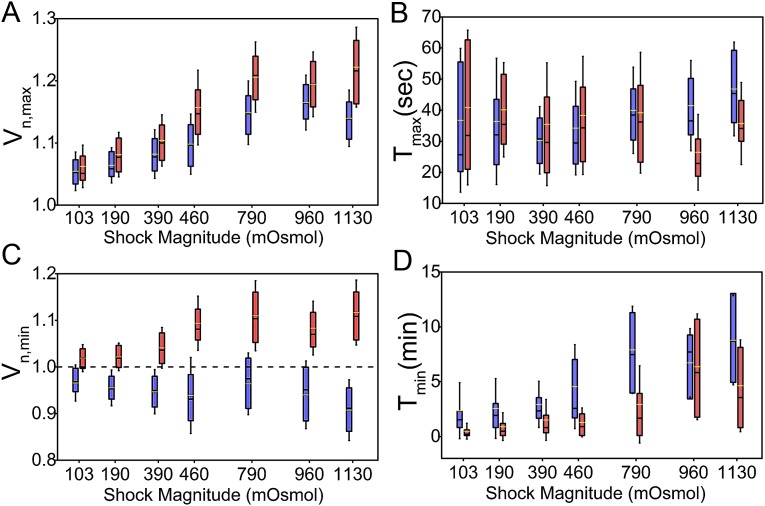
Fig. 3.
Analysis of maximum and minimum volume and time. (A) Box plot of maximum volume, , and (B) the time at which maximum volume is reached, , as a function of shock magnitude. The wild type is shown in blue, and the double mutant, in red. The upper/lower whiskers indicate 1.5× the SD value. The upper/lower edges of the boxes indicate the third/first quartile. The black line indicates the median, and the yellow line, the average value. increases with the shock magnitudes and saturates at and above 790 mOsmol. is independent from the shock magnitude for the wild type (blue) and slightly smaller for the double mutant (red) for the two largest shock magnitudes. (C) and (D) plotted against the shock magnitude for wild type (blue) and double mutant (red). in C is slightly below 1 for the wild type and decreases with the shock magnitude. for the double mutant stays above 1 in all conditions. increases with the shock magnitude for both wild-type and double-mutant cells.

