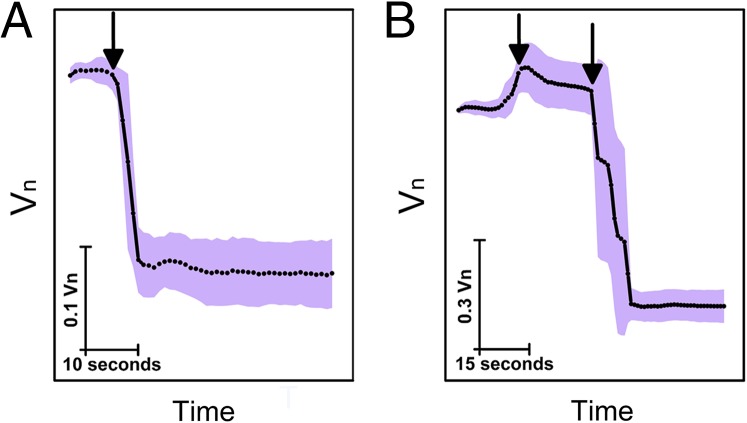
Fig. 4.
Cells, either grown at high osmolarities or subjected to a downshock, were exposed to a subsequent upshock. Normalized, average volume of (A) 13 and (B) 30 cells plotted against time in seconds. SD is given as a shaded area in light purple. (A) Cells grown in media of high osmolarity, 1,370 mOsmol, were subjected to a further increase of external osmolarity (upshock of 1,272 mOsmol). Arrow indicates the time at which shock was administered. Cell volume decreased within seconds posthyperosmotic shock. (B) Cells grown in the same media were subjected to a 1,130-mOsmol downshock indicated with the first arrow. Upon the downshock, volume expanded. At 1 min after the downshock, cells were exposed to a strong upshock of 2,160 mOsmol, indicated by the second arrow. Upon the upshock, cell volume decreased within seconds.

