Fig. 6.
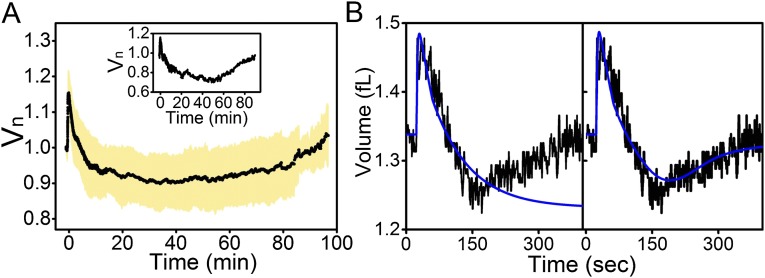
Active response and postshock growth rates. (A) Black line shows average volume against time of 36 wild-type strains exposed to a 1,310-mOsmol downshock. Cells were grown in MM9 supplemented with NaCl and transferred into sodium phosphate buffer supplemented with 5 mM KCl. Shaded orange region indicates SD. Cell volume expanded and recovered, dropping below the initial volume. Within the last 30 min, volume increase is visible. Inset shows an example of an individual trace, where volume increase occurs after is reached at 60 min postdownshock. (B, Left) Wild-type representative trace (black) and the result of the global fit (blue) taken from Fig. 5D and shown on a longer timescale. (Right) The fit (blue) is performed with the addition of the active pumping component (see SI Appendix for details on the extended model) and plotted against the same wild-type representative trace shown on the Left and in Fig. 5D (black).

