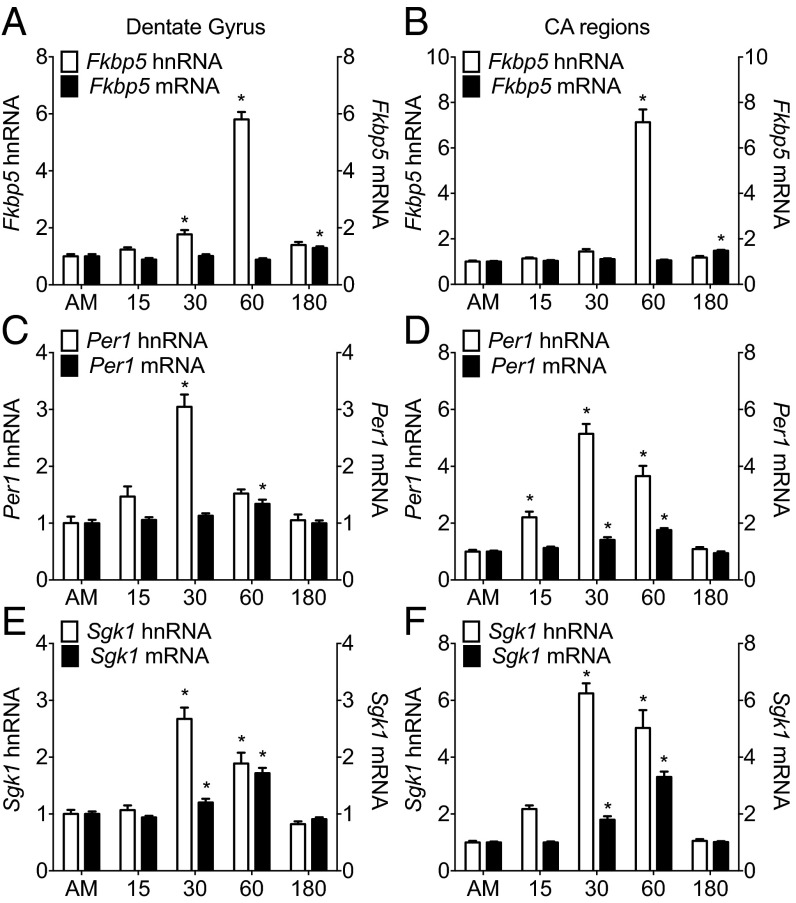
Fig. 1.
hnRNA and mRNA expression of glucocorticoid-inducible genes in hippocampal subregions under baseline conditions and after stress. Rats were killed direct from home cage (∼7:00 AM; AM baseline) or at 15, 30, 60, or 180 min after the start of FS (15 min, 25 °C water). The graphs show expression of Fkbp5, Per1, and Sgk1 in the (A, C, and E, respectively) dorsal dentate gyrus or (B, D, and F, respectively) CA regions, and they are represented as mean fold change over baseline RNA levels (±SEM; n = 7–9 per group). Expressions of both hnRNA (white bars; left y axis) and mRNA (black bars; right y axis) are shown for individual genes. More information on statistical analyses in Figs. 1, 2, 3, 4, and 5 is in SI Statistics Information to Figs. 1, 2, 3, 4, and 5. *P < 0.05 compared with AM.

