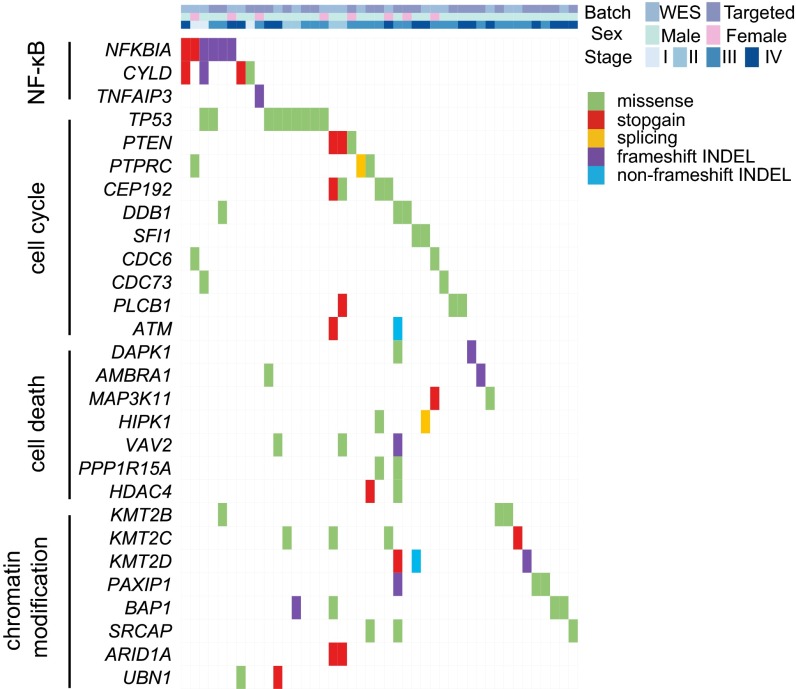
Fig. 2.
Landscape of somatic mutations in NPC. The matrix shows important mutated genes and their associated pathways in NPC primary tumors analyzed by WES and targeted resequencing. Genes are shown on left-hand side. Only genes with detectable expression in RNASeq analysis are shown. Each column represents one tumor.

