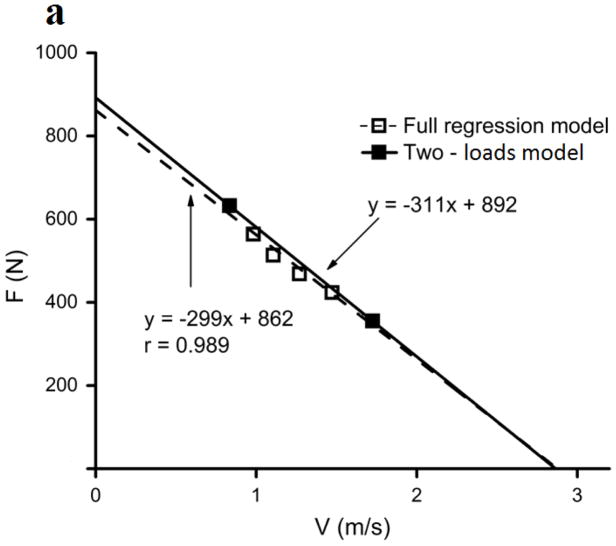
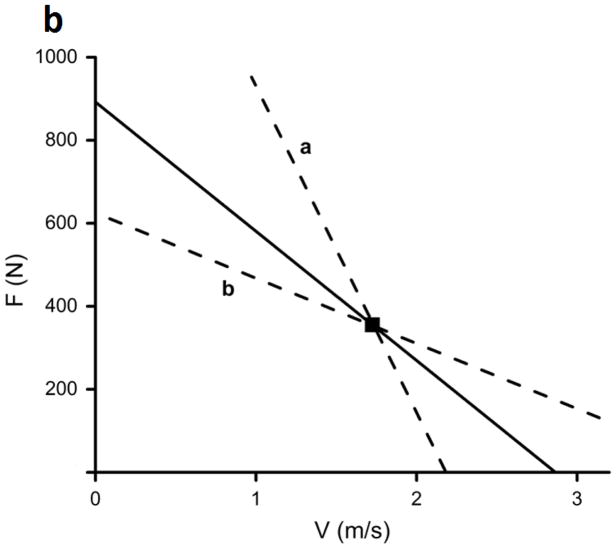
Figure 1.
(a) Force-velocity (F-V) relationship obtained from a linear regression model applied on 6 experimental points observed from bench press exercise performed against 6 different loads ranging from 20 to 57.5 kg (mass of the involved arm segments is included; data presented by solid line, and both open and filled squares). The same relationship is also shown through a two-loads model as a line determined by the first and last experimental point (dashed line and filled squares). (b) Just one of the experimental points is shown together with the same F-V relationship as in Figure 1a (solid line). Dashed lines illustrate 2 out of an infinite number of possible F-V relationships corresponding to the same point illustrating a trade-off between F0 and V0.


