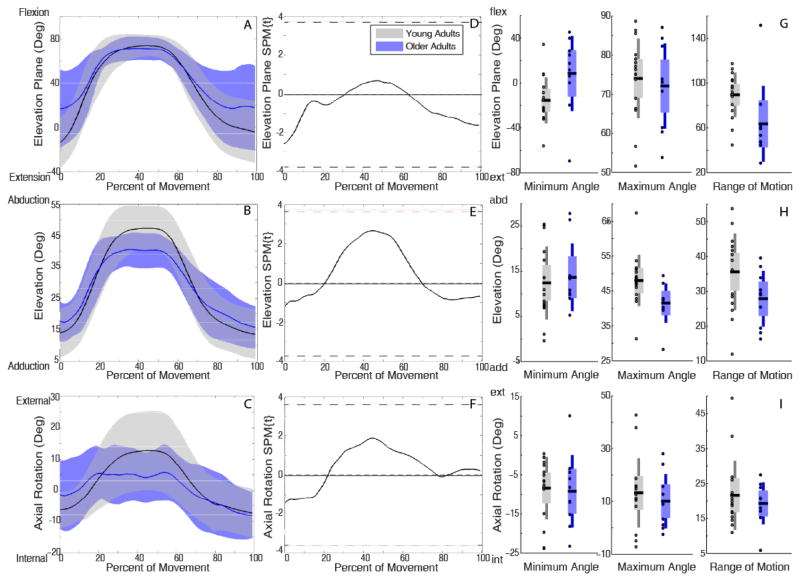
Figure 4.
Kinematic trajectories of forward reach with high load. Mean (solid line) ± SD (shaded band) for elevation plane (A), elevation (B), and axial rotation (C) with young adults in black and older adults in blue. SPM calculated t-value trajectories for elevation plane (D), elevation (E), and axial rotation (F) comparing age groups. Shaded grey areas indicate significant differences, with dotted line indicating the significance threshold (pFWE =0.05). No significant kinematic differences were identified between young and older adults in either SPM or discrete two sample t-tests (G,H,I).

