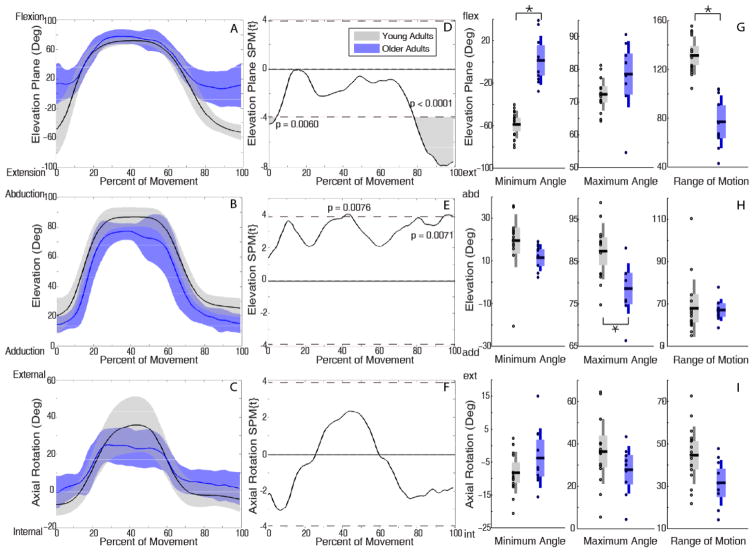
Figure 5.
Kinematic trajectories of upward reach with low load. Mean (solid line) ± SD (shaded band) for elevation plane (A), elevation (B), and axial rotation (C) with young adults in black and older adults in blue. SPM calculated t-value trajectories for elevation plane (D), elevation (E), and axial rotation (F) comparing age groups. Shaded grey areas indicate significant differences, with dotted line indicating the significance threshold (pFWE =0.05). SPM two sample t-tests indicated older adults used significantly more anterior elevation plane (A) and less elevated (B) postures during movement initiation and completion, and reduced elevation during 41%–45% of the movement. Discrete two sample t-tests showed consistent results (G, H, I). Older adults used smaller elevation plane ROM (G).

