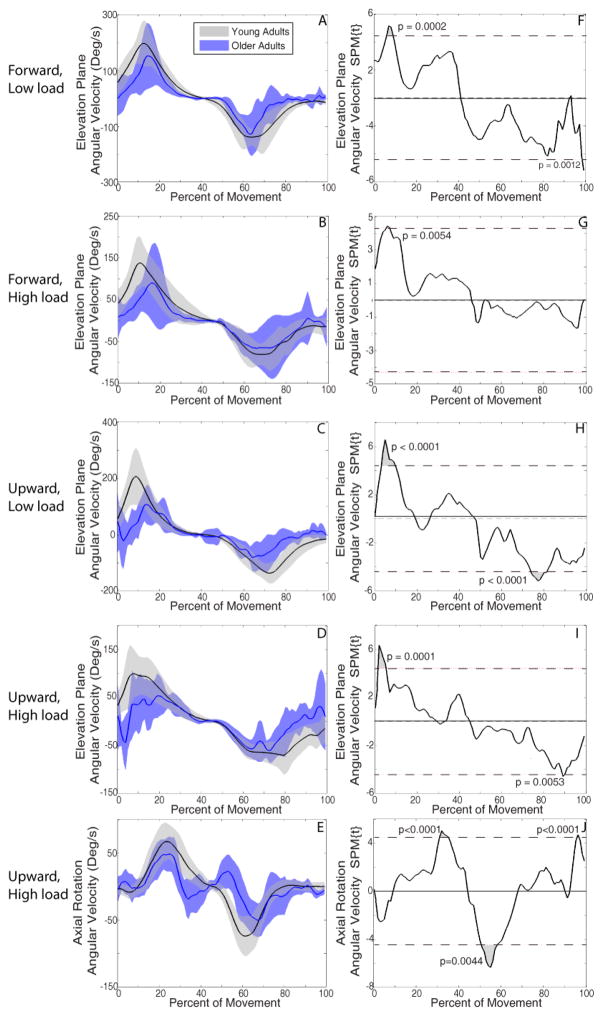
Figure 7.
Elevation plane and axial rotation angular velocity. Mean (solid line) ± SD (shaded band) of elevation plane angular velocity during forward/low load (A), forward/high load (B), upward/low load (C), upward/high load (D) and axial rotation upward/high load (E) reaches. SPM calculated t-value trajectories of elevation plane angular velocity during forward/low load (F), forward/high load (G), upward/low load (H), upward/high load (I) reaches, and axial rotation angular velocity during upward/high load (J) reach after SPM1D two sample t-tests. Shaded grey areas indicate significant differences, with dotted line indicating the significance threshold (pFWE =0.05). Older adults had more flattened velocity profiles, lower peak angular velocities, and less smooth movements as task demands increased compared to young adults across all task combinations (A–E).

