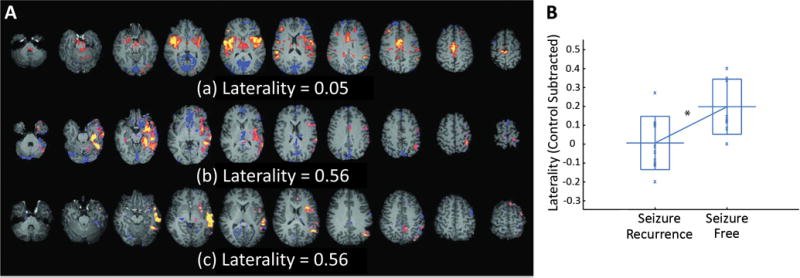
Figure 2. Functional MRI connectivity laterality as a predictor of surgical outcome in epilepsy.

A) Examples of spike-correlated fMRI-seeded functional connectivity maps with low (a), medium (b), and high (c) laterality indices. The laterality values displayed are before laterality values of the controls are subtracted. The distinct lateralization of the functional connectivity can be clearly recognized in (b) and (c). B) Control-subtracted laterality index of the spike-correlated fMRI seeded functional connectivity. Patients in the non–seizure-free group had significantly lower laterality indices than patients in the seizure-free group. The long horizontal bar shows the average, the rectangle shows the range between the average plus and minus the standard deviation, and the “x” shows a data point. *p<0.05. fMRI: functional magnetic resonance imaging. Modified with permission from Negishi et al., 2011.21
