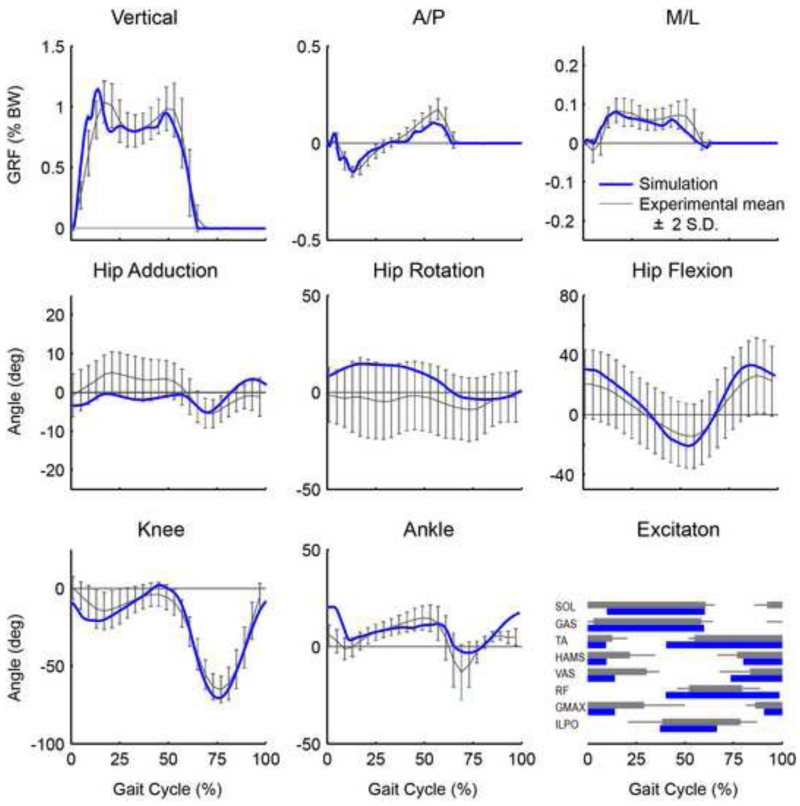
Figure 2.
Simulation tracking results. The simulated joint angles and ground reaction forces (black) agreed well with the experimental data (grey). The grey regions represent experimental means ± 2 SD. Also shown is a comparison between the model excitations with available experimentally measured EMG timing (mean onset and offset values ± 2 SD).

