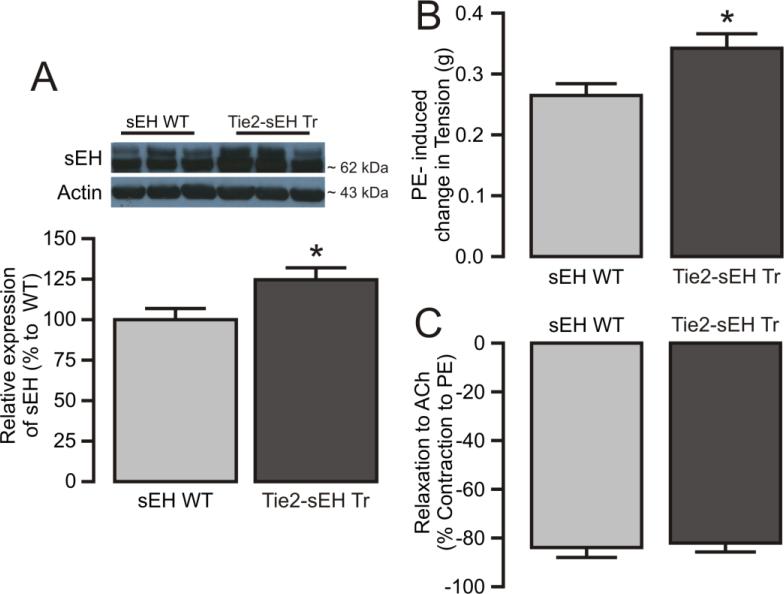
Figure 1. Characterization of vascular responses in MAs from WT and Tie2-sEH Tr mice.
(A) The top panel shows representative western blot expression of sEH in MAs from sEH WT (8 samples) and Tie2-sEH Tr mice (8 samples). The bottom panel graph shows quantification of sEH expression in sEH WT and Tie2-sEH Tr mice MAs (n=8, p<0.05). (B) PE (1 μM)-induced vascular contractions were significantly higher in Tie2-sEH Tr mice. (C) ACh (1 μM)-induced relaxation of MAs was comparable in sEH WT and Tie2-sEH Tr mice (n = 6, WT and n = 7, Tie2-sEH Tr). * indicates p < 0.05 compared to sEH WT.

