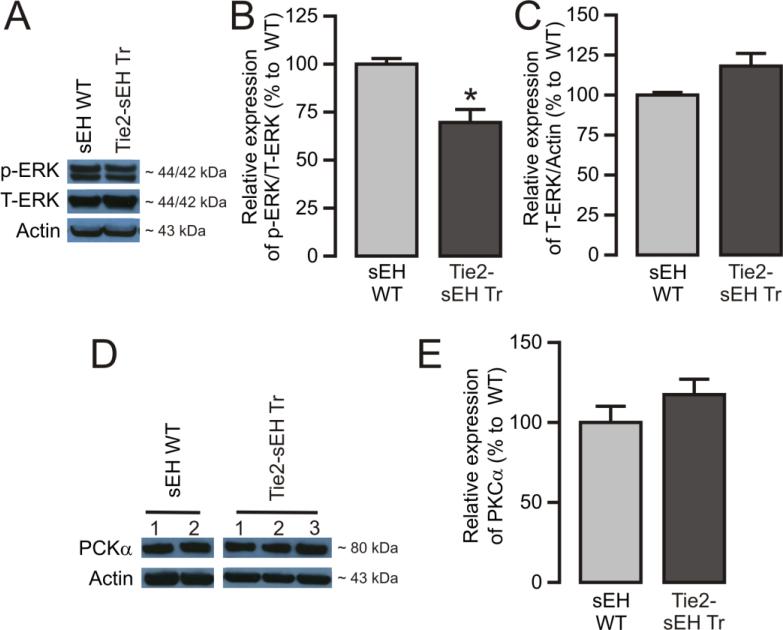
Figure 5. Western blot analysis of ERK1/2 and PKCα in MAs isolated from WT and Tie2-sEH Tr mice.
(A) Representative blot and (B) and (C) summarizes the quantification of expression of pERK1/2 and total ERK1/2, respectively, in mouse MAs (n =7 sEH WT and 8 Tie2-sEH Tr). (D) Representative blot and (E) summarizes the quantification of PKCα expression in MAs obtained from 8 different mice. * indicates p < 0.05 compared to sEH WT.

