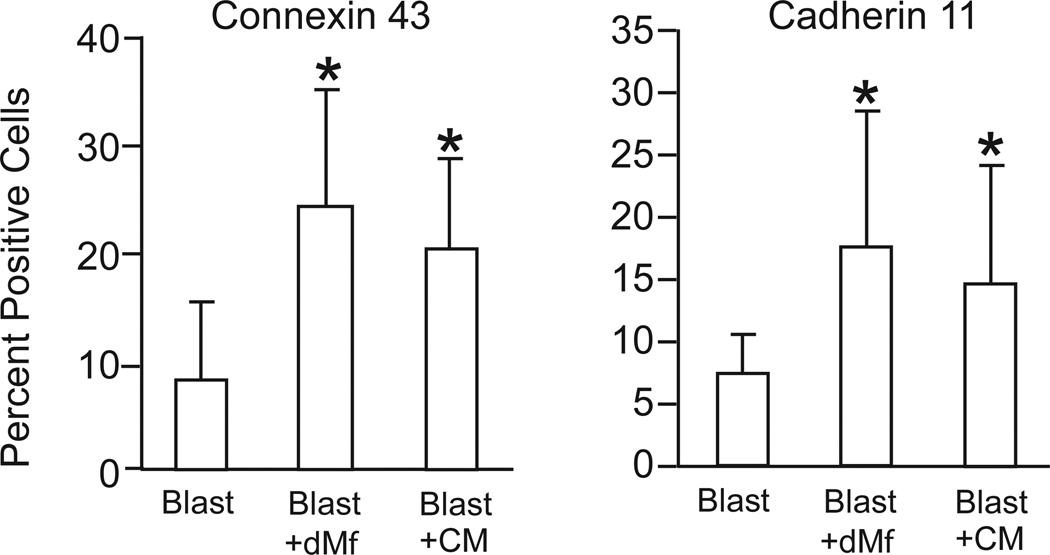
Figure 9.
Flow cytometric analysis of the surface expression of Connexin43 and Cadherin11 on trophoblasts (cytokeratin positive) cultured as blastocysts alone (Blast, n=8), blastocysts cultured in the presence of decidual macrophages (Blast + dMϕ) or in the presence of conditioned media (Blast + CM); n=4–5. Data is represented as the mean ± SD, where the asterisk denotes P < 0.05 compared to blastocysts alone.

