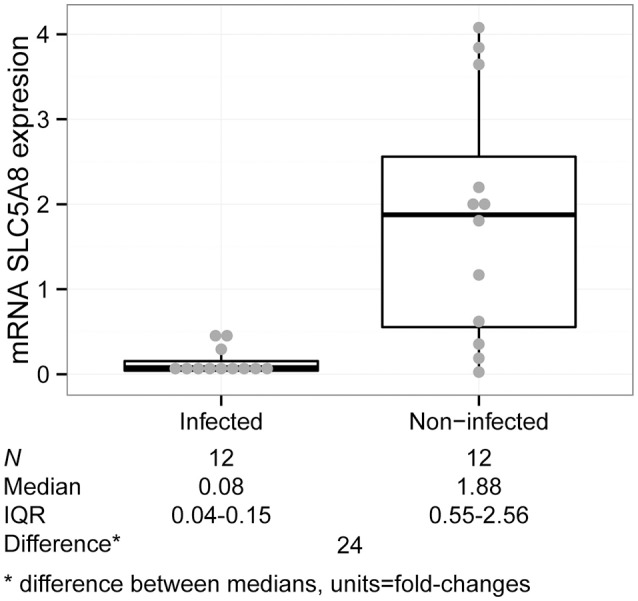
Figure 4.

SLC5A8 expression is decreased in H. pylori infected compared to non-infected children in gastric tissue samples (Kruskal–Wallis test, P = 0.001). The plot is composed of a dot plot overlying a boxplot (showing the median and IQR; points outside the whisker lines are considered outliers, as specified by Turkey's Test); summary statistics are shown beneath the graph.
