
Figure 2.
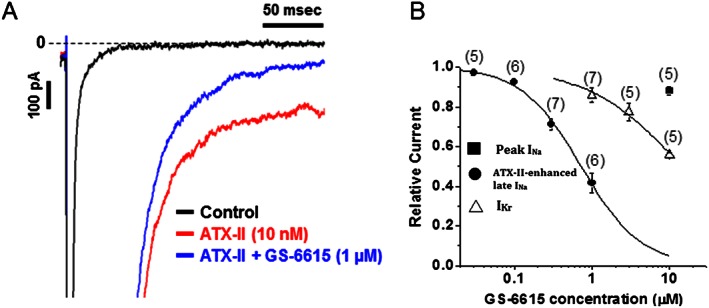
Panel A shows a typical recording of late INa measured in a rabbit ventricular myocyte under control conditions, following ATX‐II enhancement of late INa and 1 μM GS‐6615 in the continued presence of ATX‐II. Panel B shows the concentration–response curve for GS‐6615 to inhibit peak INa, ATX‐II‐enhanced late INa and IKr in rabbit ventricular myocytes. Data presented are mean ± SEM ; n = number of myocytes indicated in parenthesis.