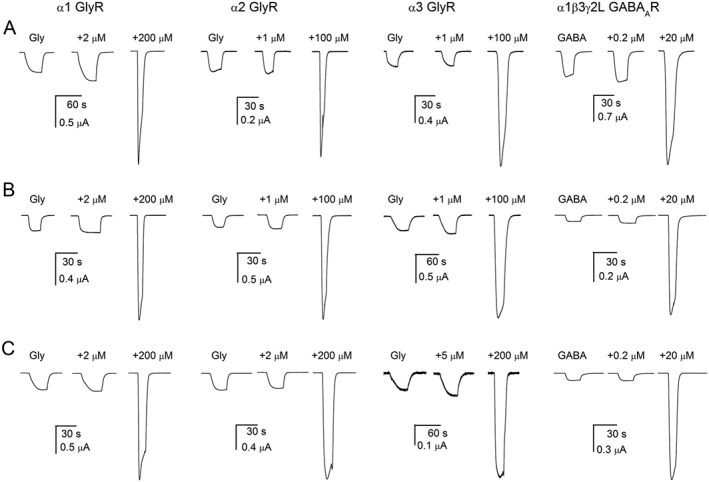
Figure 2.

Potentiation of glycine and GABAA receptors. Sample currents from oocytes expressing α1, α2 or α3 glycine (GlyR) or α1β3γ2L GABAA receptors (GABAAR). The receptors were activated by a low concentration (<EC15) of transmitter alone or in the presence of two concentrations of 4‐bp (A), 4‐CP (B) or 4‐FP (C). The concentrations of potentiators were selected to show minimal and near‐maximal potentiating effects. Full concentration–response relationships are shown in Figure 3 and fitting results summarized in Table 1.
