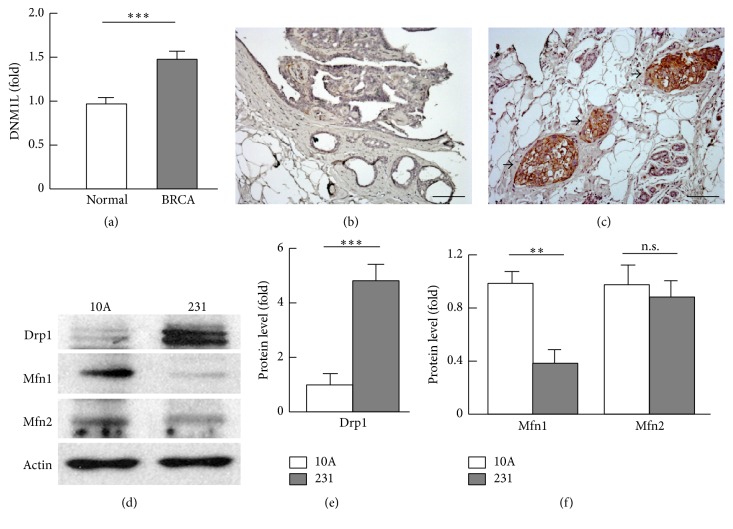
Figure 1.
Analysis of mitochondrial dynamics regulators. (a) Gene expression of DNM1L (encoding the mitophagy activator Drp1) in normal breast tissues (n = 61) and breast cancer (BRCA, n = 529) tissues. The data were extracted from TCGA (The Cancer Genome Atlas) database at Insilicom (http://insilicom.com/). (b)-(c) Immunohistochemistry analysis of Drp1 in normal breast (b) and invasive carcinoma (c) tissues. Scale bar: 100 μm; arrows indicate massively positive staining of Drp1 in the breast cancer tissues. (d) Western blot analysis of mitochondrial fission (Drp1) and fusion (Mfn1 and Mfn2) proteins in MCF-10A (abbreviated as “10A”) and MDA-MB-231 (abbreviated as “231”) cells. (e)-(f) Densitometric analysis of western blot images as shown in (d) (n = 3–5). ∗∗ p < 0.01; ∗∗∗ p < 0.001; n.s.: not significant.

