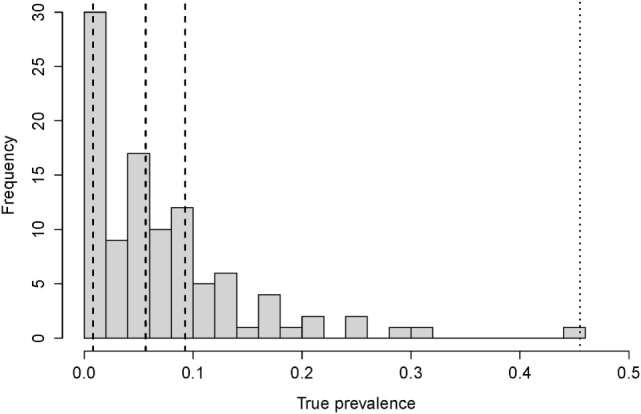
Figure 1.

The distribution of the true prevalence calculated for 102 randomly chosen herds in Denmark. The dashed lines show the 25, 50, and 75 percentiles (at 0.8, 5.6, and 9.3% prevalence, respectively), and the dotted line show the maximum observed prevalence (45%).
